
Logs overview
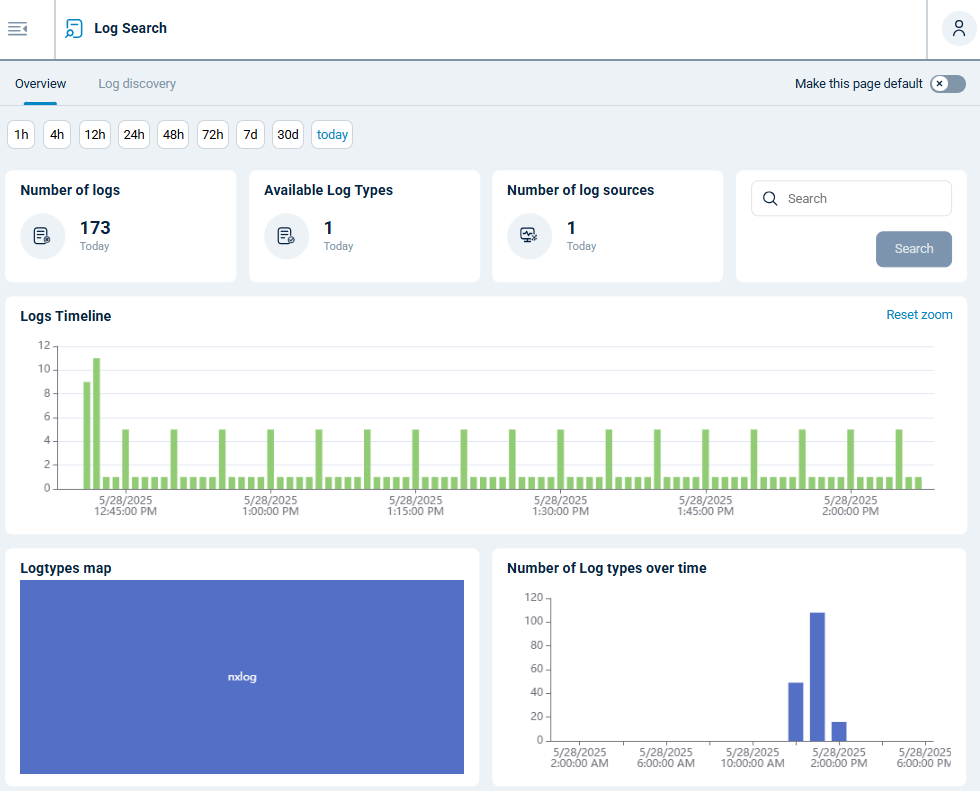
The Overview dashboard gives you a high-level view of your data. Navigate to Logs > Log search > Overview to access the dashboard.
| Widget | Description |
|---|---|
Timeframe picker |
Choose the timeframe to display data for. The options are the last 1h, 4h, 12h, 24h, 48h, 72h, 7d, 30d, or today. |
Number of logs |
Shows the number of record ingested in the selected timeframe. |
Available log types |
Shows the number of different log types processed in the selected timeframe. |
Number of log sources |
Shows the number of online agents in the selected timeframe. |
Logs timeline |
A histogram of the number of records ingested over the selected timeframe. Hover over the chart to display the record count for each data point. |
Log types map |
A treemap of event counts by log source based on the input module name, i.e., the SourceModuleName field. |
Number of log types over time |
A column chart depicting the number of distinct log source types received over the selected timeframe. It uses the SourceModuleName field to group the log types. |