
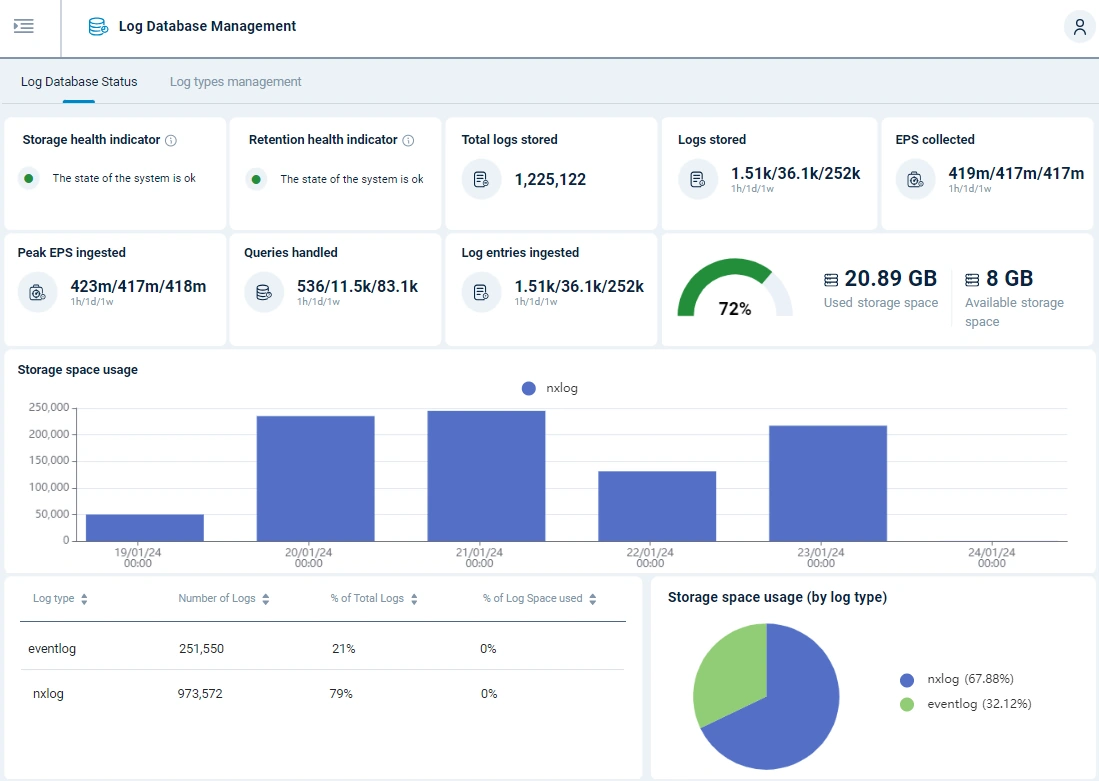
Log database status dashboard
The Log database status dashboard provides health indicators and statistics on the logs database. Navigate to Settings > Storage > Log database status to access the dashboard.
You must have the Admin or Log Search role to access this page.
| Name | Description |
|---|---|
Total stored logs |
Shows the total number of records in the database. |
Stored logs |
Shows the number of records stored in the last hour, day, and week. |
Storage statistics |
Displays statistics per log type: the total records and the percentage of total data. The log type is based on the input module name, i.e., the SourceModuleName field. |