
Create a data flow visualization
NXLog Platform allows you to create a log flow data visualization dashboard for your NXLog Agent instances. Visualizing the data flow can help you better understand your telemetry data pipeline and review data volume metrics across different parts of your system.
To create a data flow visualization dashboard:
-
From the left navigation menu, click Log flow.
-
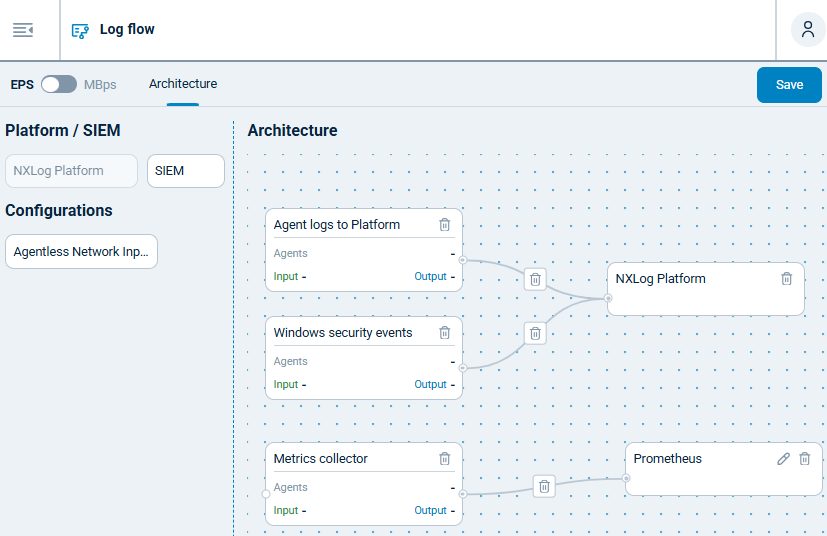
Switch to the Architecture view.
-
From the Configurations item list, drag and drop your configurations onto the Architecture panel.
-
From the Platform / SIEM item list, drag and drop your destinations onto the Architecture panel. Optionally, click the edit icon on the SIEM destination to rename it.
-
Connect your data sources and destinations by dragging the connector from a source and dropping it onto the destination.
-
Click Save in the top right corner.
-
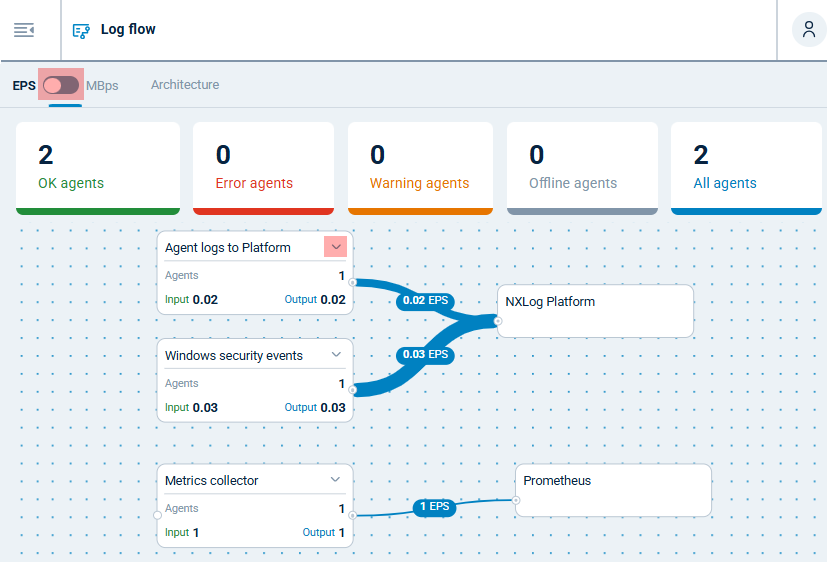
Switch to the EPS / MBps view to see the log flow visualization.
-
Click on the EPS / MBps switch to change between events and megabytes per second.
-
Click the arrow on the top right corner of each configuration to see agent status details.
-