
Troubleshoot common issues
This page provides troubleshooting tips and solutions for common NXLog Platform on-premises issues. These issues typically stem from a misconfiguration and are straightforward to resolve.
Logs are not showing in Log search but with the NXLog Platform systems logs instead
- Symptom
-
Logs from your NXLog Agent instances do not show in Log search, but you can see them with the NXLog Platform system logs.
- Possible reason
-
This issue occurs when the NXLog Platform data relay tries to forward logs to the database, but ClickHouse returns an error. In such cases, the data relay retries to send the data three times. If it fails the third time, it redirects the logs to the NXLog Platform system log. ClickHouse may fail to ingest data due to issues related to memory, buffering, or disk storage.
- Investigation
-
-
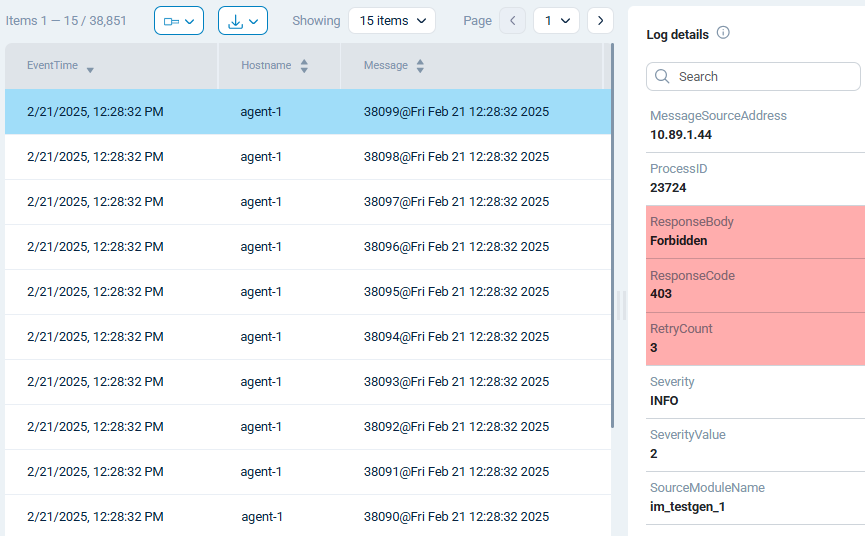
Navigate to Logs > System from the left navigation menu.
-
Verify the log contains records from your NXLog Agent instances, for example, by filtering by the hostname.
-
Select one of these records and check its ResponseCode and ResponseBody fields. These fields indicate the response that ClickHouse returned.
-
Check the logs of the
clickhouse-servercontainer for errors.Execute the following command on the machine where NXLog Platform is installed:
$ sudo podman logs $(sudo podman ps -a | grep clickhouse-server: | awk '{print $1}') 2>&1 | grep "Error"
-
- Solution
-
The solution depends on the ClickHouse error and may require further troubleshooting. If you need assistance, please open a support ticket, and one of our experts will contact you.
Agents are sending logs to NXLog Platform but Log search does not show any new logs
- Symptom
-
You have verified that your NXLog Agent instances are sending logs and there are no errors from the agent side. However, you do not see the new logs in NXLog Platform.
You may also see errors like the following when you navigate to Logs > Log search > Log discovery.
ClickHouse error: network error: error sending request for url (http://clickhouse:8123/?database=nxlog&query=DESCRIBE+TABLE+%60logs%60+FORMAT+JSONEachRowWithProgress) - Possible reason
-
The logs database ran out of memory and stopped processing logs or was shut down by the operating system’s OOM Killer.
- Investigation
-
Check the database logs for any memory-related errors. Perform the following steps on the machine where NXLog Platform is installed:
-
Check the logs of the
clickhouse-servercontainer.$ sudo podman logs $(sudo podman ps -a | grep clickhouse-server: | awk '{print $1}') 2>&1 | grep "memory limit exceeded"If it’s a memory issue, you may see logging like the following:
2025.02.20 10:37:53.382959 [ 630 ] {} <Error> MergeTreeBackgroundExecutor: Exception while executing background task {9e5d59d5-ae29-494e-9d77-856bbc9ad088::202502_1_3455_300}: Code: 241. DB::Exception: (total) memory limit exceeded: would use 3.36 GiB (attempt to allocate chunk of 4361744 bytes), current RSS 533.26 MiB, maximum: 3.36 GiB. (MEMORY_LIMIT_EXCEEDED) -
If not, check the operating system logs for out-of-memory errors.
Ubuntu
$ grep -i -E "oom|out of memory" /var/log/syslogRHEL
$ grep -i -E "oom|Out of memory" /var/log/messagesIf the operating system terminated the container, you will see logging similar to the following:
Feb 21 14:35:21 rhel kernel: Out of memory: Killed process 5678 (podman) total-vm:1048576kB, anon-rss:512000kB, file-rss:1024kB, shmem-rss:2048kB, UID:1000 pgtables:256kB oom_score_adj:0
Feb 21 14:35:21 rhel kernel: oom_reaper: reaped process 5678 (podman), now anon-rss:0kB, file-rss:0kB, shmem-rss:0kB
-
- Solution
-
-
Ensure that you provision enough memory for NXLog Platform to store logs. Check the CPU and RAM requirements in the installation guide.
-
Configure log storage in NXLog Platform by following these steps:
-
Open
/etc/nxp.confwith a text editor.$ sudo nano /etc/nxp.conf -
Set the value of
NXP_STORE_LOGStotrue. -
Save your changes.
-
-
Apply the new settings and restart NXLog Platform.
$ sudo nxp_manage.sh apply
-
ClickHouse error: network error: error sending request for URL
- Symptom
-
NXLog Platform pages do not show log data and statistics, but they show the following error:
ClickHouse error: network error: error sending request for URL (http://clickhouse:8123/?database=nxlog...) - Possible reason
-
The ClickHouse database server is unreachable.
- Investigation
-
Check the status of the ClickHouse container to ensure that it is up and running by executing the following command:
$ sudo podman ps -a | grep clickhouse-serverThe container status is
UpandHealthywhen it is running as expected.Also, check whether the internal NXLog Agent relay can connect to ClickHouse:
$ sudo podman logs $(sudo podman ps -a | grep internal-nxlog | awk '{print $1}') 2>&1 | grep "ERROR"You may see the following errors if the ClickHouse database server is down:
ERROR [om_http|om_application_logs_clickhouse] couldn't resolve any of the configured hosts ERROR [om_http|om_application_logs_clickhouse] Unable to resolve hostname 'clickhouse': Name or service not known - Solution
-
Try restarting the ClickHouse container:
$ sudo podman restart $(sudo podman ps -a | grep clickhouse-server | awk '{print $1}')If the issue persists, please open a support ticket, and one of our experts will contact you.
Log Search shows JSON fields as strings
- Symptom
-
Some JSON fields in log events are not parsed as a JSON object but as a string.
- Possible reason
-
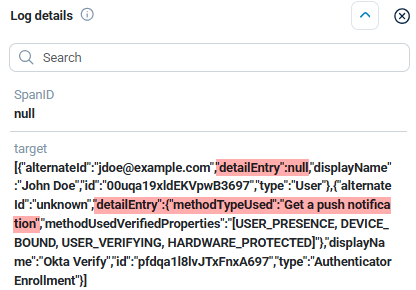
The field contains tuples with the same key but different value types. For example:
- Investigation
-
Check your log event data for any inconsistencies.
- Solution
-
This is the expected behavior when named tuples contain ambiguous paths. Refer to Automatic schema inference and the
input_format_json_use_string_type_for_ambiguous_paths_in_named_tuples_inference_from_objectssetting in the ClickHouse documentation for more information.