
Dashboards
NXLog Platform dashboards are a way to customize data visualization according to your needs. Access your custom dashboards by navigating to Dashboards from the left navigation menu.
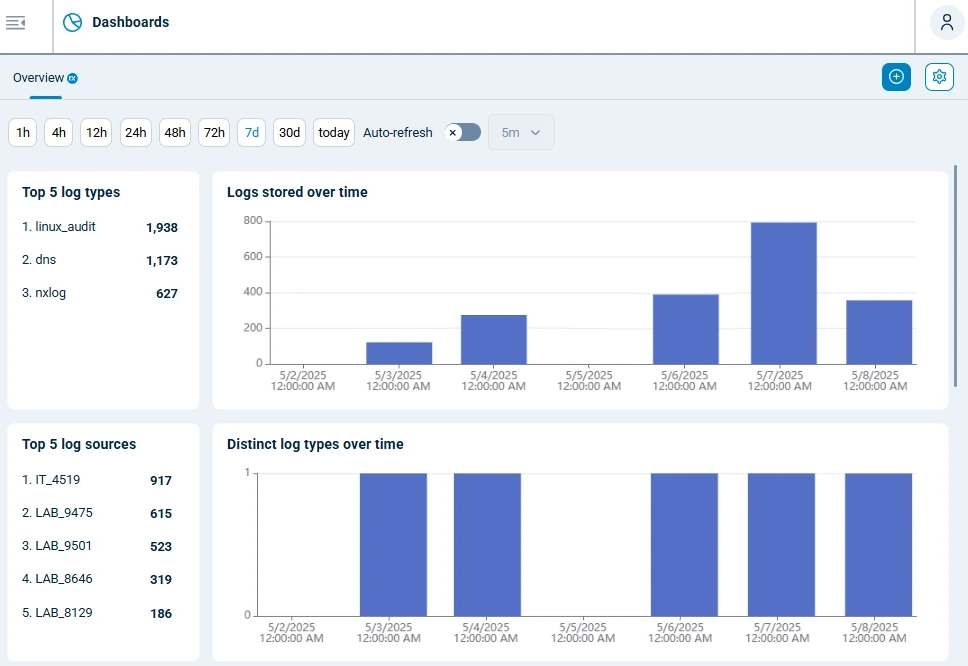
Overview dashboard
The default Overview dashboard offers immediate insight into your data. It comprises a set of predefined metrics and charts to provide a broad overview of your data.
| Widget | Description |
|---|---|
Timeframe picker |
Choose the timeframe to display data for. The options are the last 1h, 4h, 12h, 24h, 48h, 72h, 7d, 30d or today. |
Auto-refresh |
This switch determines whether to automatically refresh the data or not. When activated, you can choose the refresh frequency from the last 5m, 10m, or 30m. |
Top 5 log types |
Lists the most popular log types in the selected timeframe. |
Logs stored over time |
A column chart depicting the number of records in the database over the selected timeframe. Hover over the chart to display the record count for each data point. |
Top 5 log sources |
Lists the most popular log sources in the selected timeframe. |
Distinct log types over time |
A column chart depicting the number of distinct log types received in the selected timeframe. |
Distinct log sources over time |
A column chart depicting the number of distinct log sources that sent data in the selected timeframe. |
All log types |
A treemap depicting the different log types processed in the selected timeframe. |
Agents versus distinct log types |
An interactive sunburst chart showing log types by agents. |
Custom dashboards
Custom dashboards allow you to tailor views with charts and metrics to meet your needs. See Create a dashboard to start personalizing your views.
When creating a custom dashboard, you can add widgets and metrics, customize the layout, and apply filters to focus on a specific data subset. You can also add search, filtering, timeframe selector, and auto-refresh controls to allow users to interact with the dashboard.
See Dashboard widgets for more information on the available widgets.