
Navigating the NXLog Platform UI
The NXLog Platform web interface is where you will manage your user account, organization, NXLog Agent fleet, and log storage. It is also where you can search and analyze your logs and create custom dashboards according to your needs.
Overview
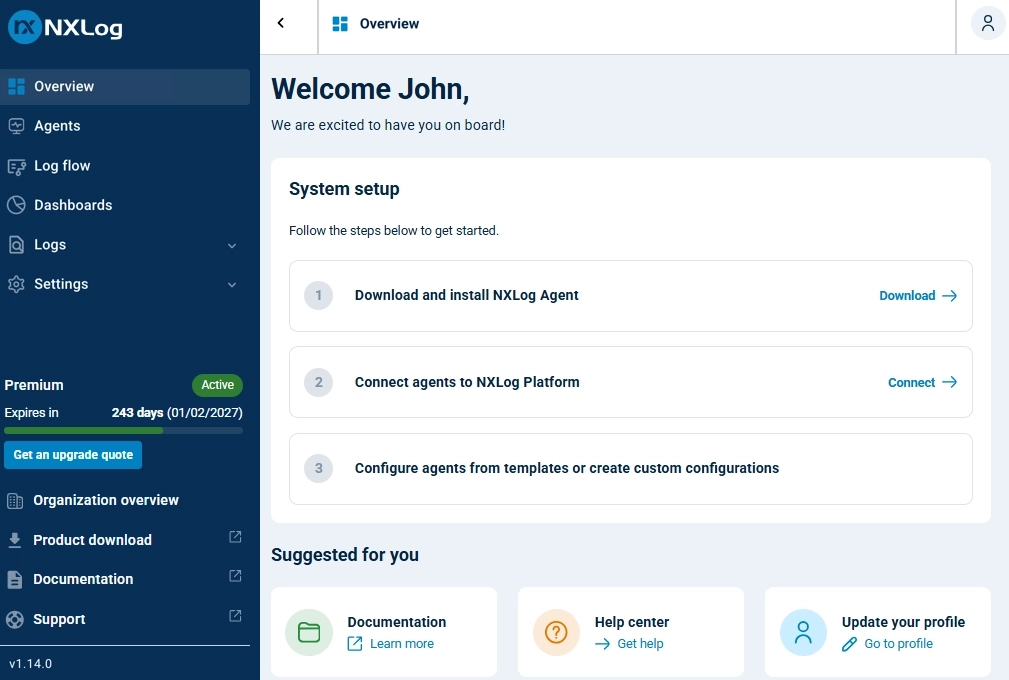
When you sign in to the NXLog Platform portal, you are greeted with the Overview page, where you can find helpful links and information. Whether it is your first login or returning to manage your deployment, use this page to access your NXLog Agent packages, Agent Manager settings, documentation, and help center.
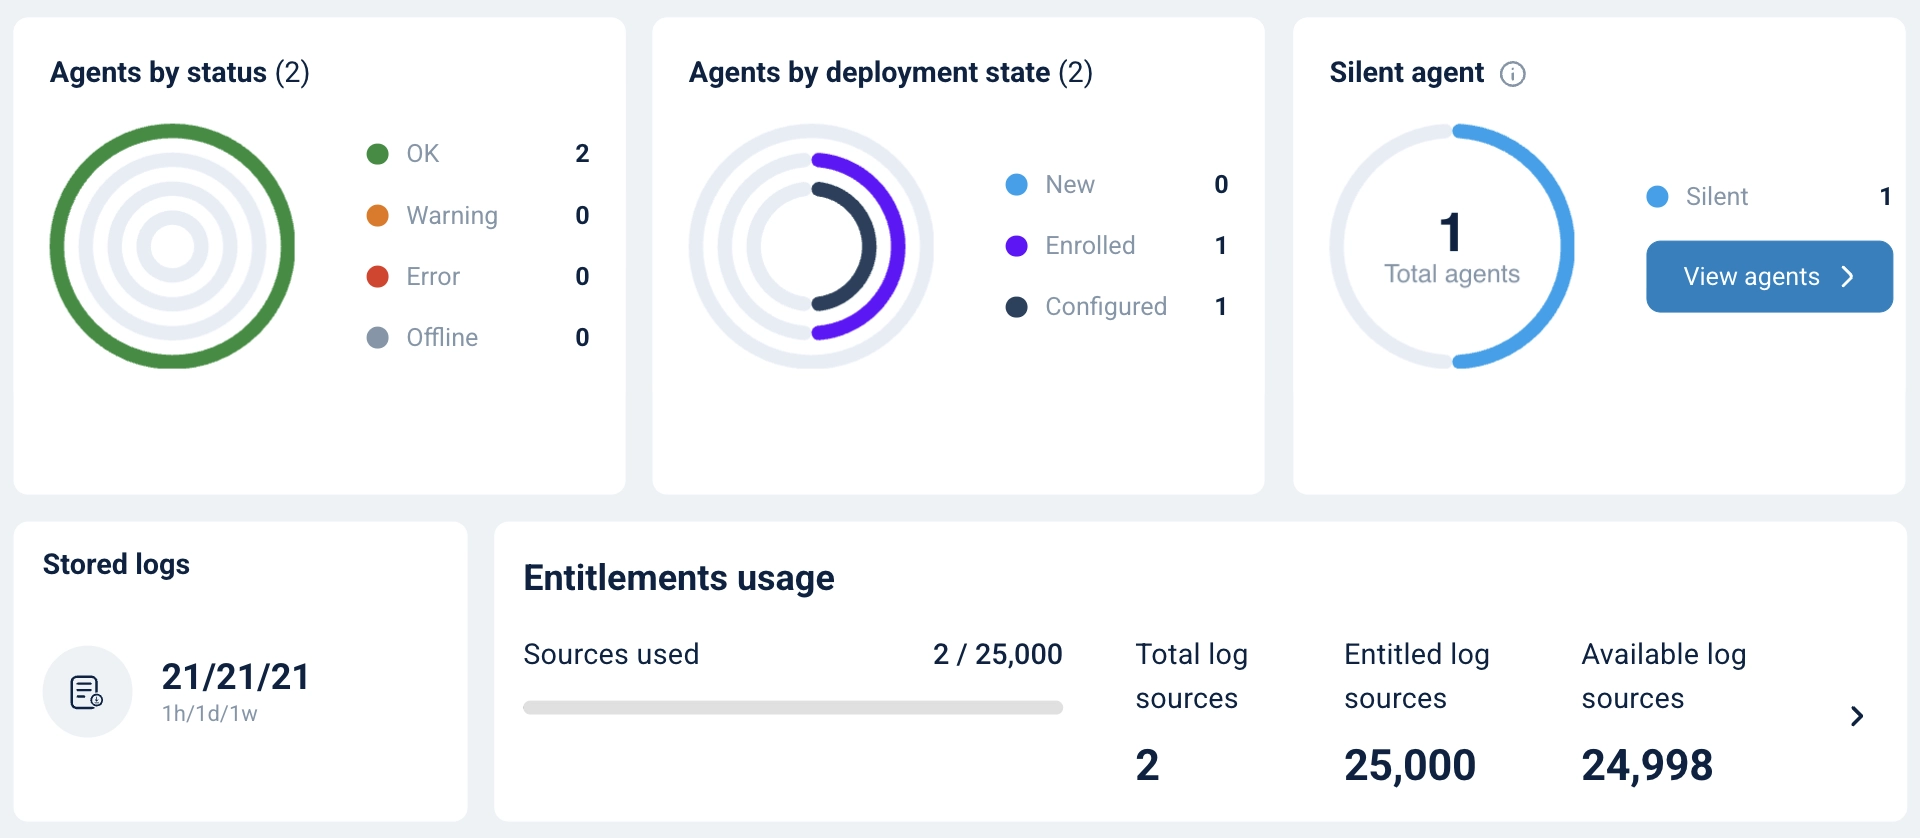
Once you connect your first NXLog Agent instance, this page instead summarizes your deployment status, including a widget showing your entitlements usage.
| Item | Description |
|---|---|
Sources used |
A progress bar showing the number of log sources used against your entitled quota. |
Total log sources |
The total number of log sources currently in use across your deployment. |
Entitled log sources |
The number of log sources included in your license. |
Available log sources |
The number of log sources you can still add before reaching your entitled quota. |
Overage |
The number of log sources over your entitled quota. This only appears once your usage exceeds your entitled quota. |
Select the chevron on the right to view a detailed breakdown of your log source usage. See Entitlements usage for more information.
Navigation
Use the left navigation menu to access the different areas of NXLog Platform.
| Item | Description |
|---|---|
Overview |
This is the landing page when you sign in to NXLog Platform. It contains quick links to commonly used features. Once you connect agents, this page summarizes your deployment status. |
Agents |
Provides agent management features, including an overview and list of your agents, agent configurations, auto-enroll rules, and the Agent Management API reference. |
Log flow |
Create an end-to-end log flow visualization to better understand your telemetry data pipeline. |
Dashboards |
Create custom dashboards fine-tuned to your needs. A default, generic dashboard is available to get you started. |
Logs |
Everything related to the log activity in NXLog Platform:
|
Settings |
Everything related to configuration of the different areas of your deployment:
|
At the bottom of the left navigation menu, you also have information and links to:
-
Upgrade your subscription plan
-
View your organization details
-
Download the NXLog Agent and NXLog Platform installers
-
Open the NXLog Platform documentation
-
Request support
-
The current NXLog Platform version, the latest version if an update is available, and release notes
Next steps
You’re now familiar with the NXLog Platform UI. Choose one of the following to continue your journey, or check out our documentation center to learn more about NXLog Platform.