
Resources
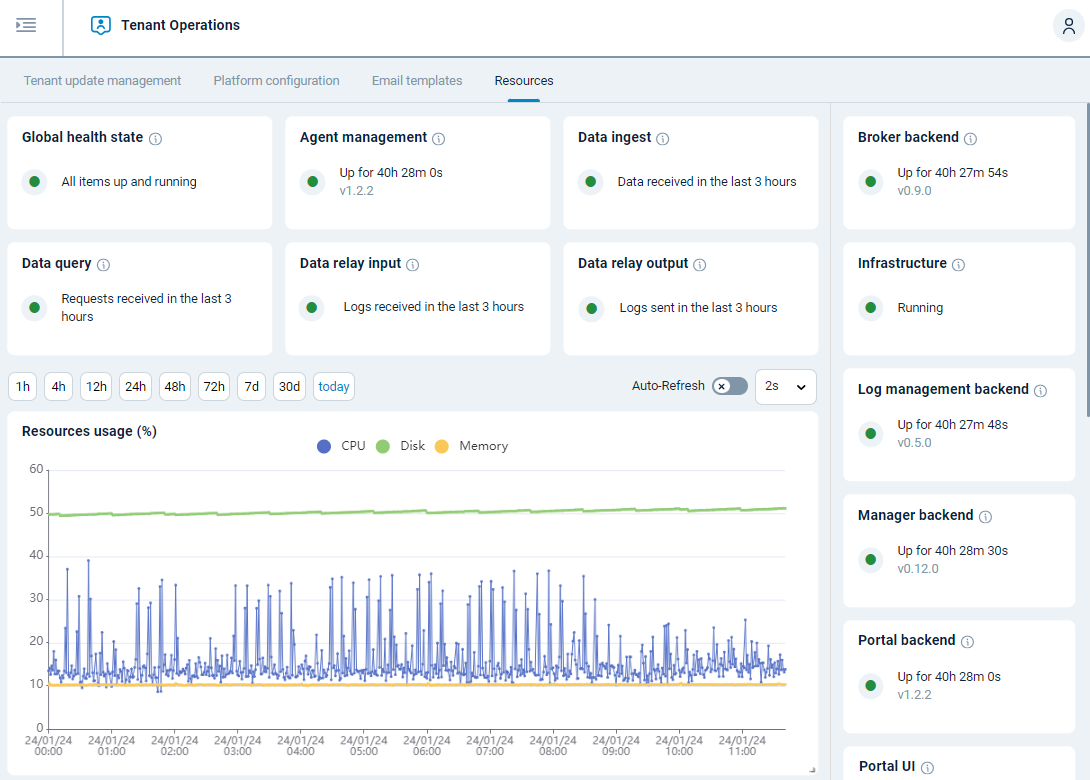
The Resources dashboard provides an overview of the NXLog Platform health status and resource usage. Navigate to Administration > Tenant Operations > Resources to view this page:
| Panel | Description |
|---|---|
Global health state |
General NXLog Platform instance health status indicator. The possible states are:
|
Agent management |
Health status indicator for the Agent management component. The possible states are:
|
Data ingest |
Displays the log data ingestion status. The possible states are:
|
Data query |
Displays the log analytics status. The possible states are:
|
Data relay input |
Displays the log ingestion status of the input relay. The possible states are:
|
Data relay output |
Displays the log forwarding status of the output relay. The possible states are:
|
Resources usage |
A timeline chart showing the overall CPU, disk, and memory usage. You can:
|
Components |
A list of NXLog Platform components showing the component status, version, and current uptime. |