Agent Information
The following agent information page is loaded when an Online agent is selected by clicking the agent’s name.
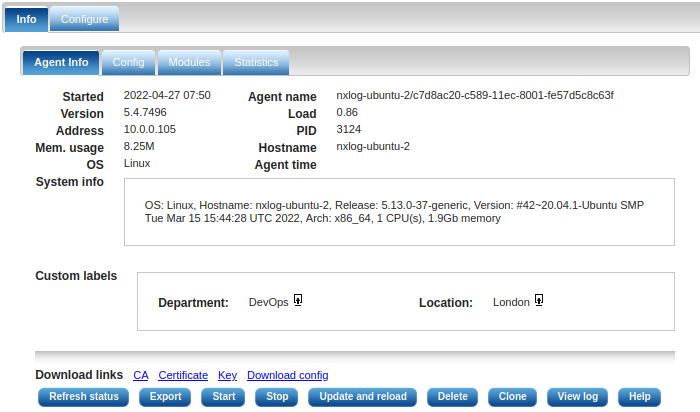
The page will show less information if the agent is not connected to the agent manager. Custom labels are displayed if the xm_admin instance in the agent configuration defines Labels.
The action buttons on this page function similarly to those on the agent list page.
If the agent is Online and some of its modules has variables or statistical counters, they will appear on this page in a table.
Modules
Click the Modules tab to show detailed information about each module as shown in the following image.
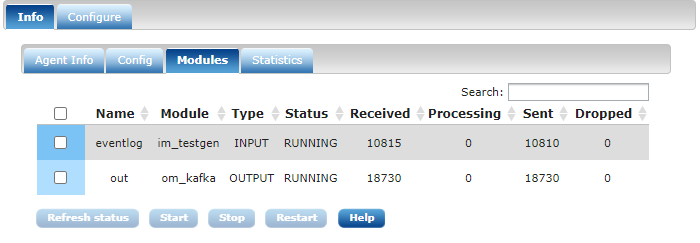
This information is only available when the agent is Online. The table contains the following information.
- Name
-
The name of the module instance.
- Module
-
The type of the loadable module which was used to create the module instance.
- Type
-
The type of the module:
-
INPUT
-
PROCESSOR
-
OUTPUT
Extension module instances are not shown.
-
- Status
-
-
STOPPED
-
RUNNING
-
PAUSED
-
UNINITIALIZED
The module may become PAUSED if it cannot send or forward the output. This is caused by the built-in flow control and is perfectly normal unless you see the module in this status for a longer period and the number of sent messages does not increase. You do not need to start the module when it is PAUSED, it will resume operations automatically.
-
- Received
-
The number log messages received or read.
- Processing
-
The number of log messages in the module’s queue waiting to be processed.
- Sent
-
The number of log messages written or sent by the module.
- Dropped
-
The module may filter and drop some messages. This number will be shown here. This is calculated using the value reported in Received and Sent.
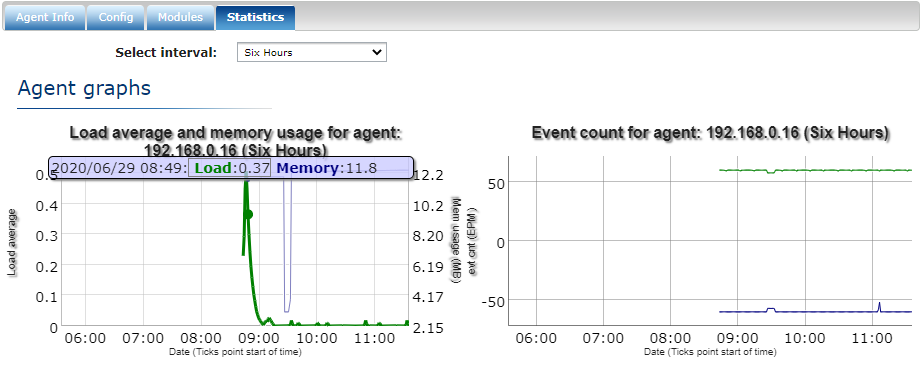
Statistics
Click the Statistics tab to display several interactive graphs. There is a graph for each of the following parameters:
-
System load & memory usage
-
Total event count
-
Event counts for each module
Optionally, additional graphs can be added for module variables and statistical counters by clicking the Add chart button.
Select a module and fill in the name of the variable. Regular expressions of the name are also supported.
Select the graph’s interval from the following values displayed in the drop-down menu:
-
Six hours
-
One day
-
One week
-
One year