
Quick start dashboard
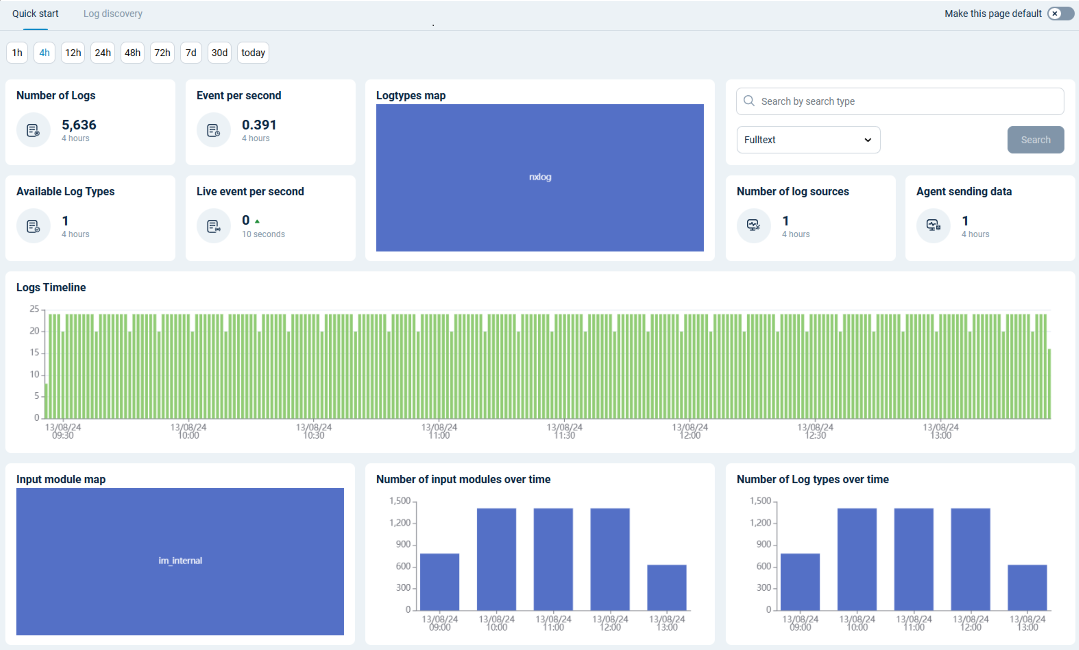
The Quick start dashboard gives you a high-level view of your log data. Navigate to Log Search > Quick start to access the dashboard.
| Widget | Description |
|---|---|
Timeframe Picker |
Choose the timeframe to display data for. The options are the last 1h, 4h, 12h, 24h, 48h, 72h, 7d, 30d, or today. |
Number of Logs |
Shows the number of logs ingested in the selected timeframe. |
Events Per Second |
Shows the log ingestion Events Per Second (EPS) rate for the selected timeframe. |
Available Log Types |
Shows the number of different log types processed in the selected timeframe. |
Live events per second |
Shows the real-time EPS rate of logs ingested in the last 5 seconds with auto-refresh. |
Log Types |
A treemap of event counts by log source based on the input module name, i.e., the SourceModuleName field. |
Search |
Quickly search for a term. The results are displayed in the Log discovery tab. |
Number of log sources |
Shows the number of online agents in the selected timeframe. |
Agent sending data |
Shows the number of agents that sent logs in the selected timeframe. |
Logs Timeline |
A histogram of the number of logs ingested over the selected timeframe. Hover over the chart to display the log count for each data point. |
Input module map |
A treemap of event counts by input module type, e.g., im_file, im_msvistalog, im_linuxaudit, etc. |
Number of input modules over time |
A column chart depicting the number of distinct input module types that sent logs over the selected timeframe. It uses the SourceModuleType field to group the input modules. |
Number of log types over time |
A column chart depicting the number of distinct log source types received over the selected timeframe. It uses the SourceModuleName field to group the log types. |