
VMware vCenter
NXLog Agent can be used to capture and process logs from VMware vCenter. This guide explains how to do this with vCenter 6.7.0.51000 installed on Windows Server 2016.
vCenter logs can be processed in two ways.
-
NXLog Agent can be installed directly on the vCenter host machine and configured to collect all logs locally. This method provides more feedback and more detailed logs and is the recommended method. See Local vCenter logging.
-
Alternatively, vCenter logs can be collected remotely using the vSphere Perl SDK. This option is less flexible but may be the only feasible option in some environments due to security restrictions. See Remote vCenter logging.
Local vCenter logging
-
Install NXLog Agent on the vCenter host machine.
-
Log in to the vCenter client.
-
Select the vCenter instance from the left side menu.
-
Click on Configure under the Settings portion click General.
-
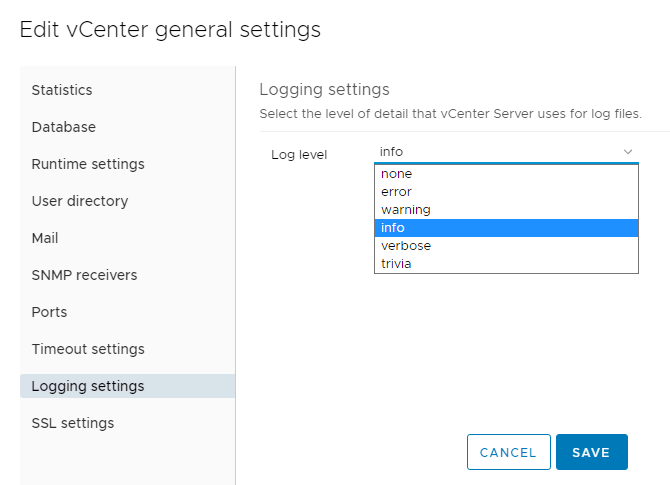
Click on Edit, the button is found on the right side of the vCenter Server Settings screen.
-
Click on Logging Settings and change the Log level to verbose and click on Save.
-
vCenter will now start writing detailed logging. The location of the logs depends on the version of vCenter you are running.
-
vCenter Server 6.x on Windows 2012 and 2016:
C:\ProgramData\VMware\vCenterServer\logs\ -
vCenter Server 6.x Linux Virtual Appliance:
/var/log/vmware/vpxd/ -
vCenter Server 6.x Linux Virtual Appliance UI (Photon OS):
/storage/log/vmware/applmgmt/vami.log
-
-
Determine which log files you want to parse and collect.
Table 1. VMware vCenter log files (Source) Filename Description vpxd.logThe main vCenter Server logs, consisting of all vSphere Client and WebServices connections, internal tasks and events, and communication with the vCenter Server Agent (
vpxa) on managed ESX/ESXi hosts.vpxd-profiler.logandprofiler.logProfiled metrics for operations performed in vCenter Server. Used by the VPX Operational Dashboard (VOD) accessible at
https://VCHost/vod/index.html.vpxd-alert.logNon-fatal information logged about the
vpxdprocess.cim-diag.logandvws.logCommon Information Model monitoring information, including communication between vCenter Server and managed hosts' CIM interface.
drmdump(directory)Actions proposed and taken by VMware Distributed Resource Scheduler (DRS), grouped by the DRS cluster managed by vCenter Server. These logs are compressed.
ls.logHealth reports for the Licensing Services extension, connectivity logs to vCenter Server.
vimtool.logDump of string used during the installation of vCenter Server with hashed information for DNS, username and output for JDBC creation.
stats.logProvides information about the historical performance data collection from the ESXi/ESX hosts.
sms.logHealth reports for the Storage Monitoring Service extension, connectivity logs to vCenter Server, the vCenter Server database and the xDB for vCenter Inventory Service.
eam.logHealth reports for the ESX Agent Monitor extension, connectivity logs to vCenter Server.
catalina.date.logandlocalhost.date.logConnectivity information and status of the VMware Web Management Services.
jointool.logHealth status of the VMwareVCMSDS service and individual ADAM database objects, internal tasks and events, and replication logs between linked-mode vCenter Servers.
The various log files use different formats. You must examine your chosen file to determine how to parse its entries. The main log file,
vpxd.log, contains all login and management information. This file is used as an example. The file has the general format oftimestamp [tag-1] [optional-tag-2] message, and the message section might contain a multiline trace.vpxd.log sample2021-11-26T23:41:19.706-08:00 verbose vpxd[08160] [Originator@6876 sub=vmomi.soapStub[12]] Resetting stub adapter for server <cs p:00000295e8fa4bf0, TCP:localhost:10080> : Closed 2021-11-26T23:41:19.299-08:00 verbose vpxd[08224] [Originator@6876 sub=Default opID=HB-host-9@584-75dd5330] [VdbODBCError::VdbODBCError] SQLGetDiagRec SQLState='08001' NativeError=101 MessageText='could not connect to server: Connection refused (0x0000274D/10061) --> Is the server running on host "localhost" (::1) and accepting --> TCP/IP connections on port 5432? --> could not connect to server: Connection refused (0x0000274D/10061) --> Is the server running on host "localhost" (127.0.0.1) and accepting --> TCP/IP connections on port 5432? --> ' rc=0 -
Configure and restart NXLog Agent.
In this configuration, the xm_multiline extension module is used with the HeaderLine directive to parse log entries even when they span multiple lines. An Exec directive is used to drop all empty lines. A regular expression with matching groups adds fields to the event record from each log message, and the resulting log entries are sent to another host via TCP in JSON format.
<Extension vcenter>
    Module        xm_multiline
    HeaderLine    /(?x)(\d+-\d+-\d+T\d+:\d+:\d+.\d+-\d+:\d+)\s+\S+\s+vpxd\[\d+\]\s+\[(.*?)\]\s+ \
                  (?:\[(.*?)\]\s+)?((.*\s*)*)/
    Exec          if $raw_event =~ /^\s+$/ drop();
</Extension>

<Extension _json>
    Module        xm_json
</Extension>

<Input in>
    Module        im_file
    File          "C:\ProgramData\VMware\vCenterServer\logs\vmware-vpx\vpxd*.log"
    InputType     vcenter
    <Exec>
        if $raw_event =~ /(?x)(\d+-\d+-\d+T\d+:\d+:\d+.\d+-\d+:\d+)\s+\S+\s+vpxd\[\d+\]\s+\[(.*?)\]\s+
                          (?:\[(.*?)\]\s+)?((.*\s*)*)/
        {
            $EventTime = parsedate($1);
            $Tag1 = $2;
            $Tag2 = $3;
            $Message = $4;
        }
    </Exec>
</Input>

<Output out>
    Module        om_tcp
    Host          192.168.1.1
    Port          1514
    Exec          to_json();
</Output>{
"EventReceivedTime":"2021-11-28T11:19:00.666848-08:00",
"SourceModuleName":"in",
"SourceModuleType":"im_file",
"EventTime":"2021-11-26T23:41:19.706000-08:00",
"Tag1":"Originator@6876 sub=vmomi.soapStub[12]",
"Tag2":"",
"Message":"Resetting stub adapter for server <cs p:00000295e8fa4bf0, TCP:localhost:10080> : Closed\r"
}
{
"EventReceivedTime":"2021-11-28T11:19:00.666848-08:00",
"SourceModuleName":"in",
"SourceModuleType":"im_file",
"EventTime":"2021-11-26T23:41:19.299000-08:00",
"Tag1":"Originator@6876 sub=Default opID=HB-host-9@584-75dd5330",
"Tag2":"VdbODBCError::VdbODBCError",
"Message":"SQLGetDiagRec SQLState='08001' NativeError=101 MessageText='could not connect to server: Connection refused (0x0000274D/10061)\r--> \tIs the server running on host \"localhost\" (::1) and accepting\r--> \tTCP/IP connections on port 5432?\r--> could not connect to server: Connection refused (0x0000274D/10061)\r--> \tIs the server running on host \"localhost\" (127.0.0.1) and accepting\r--> \tTCP/IP connections on port 5432?\r--> ' rc=0\r"
}Remote vCenter logging
This method of capturing vCenter logs uses a Python script with the vSphere SDK. The script periodically connects to the vCenter server and retrieves logs.
-
Download and install the latest version of the VMware Python SDK from the GitHub repository or by downloading it through pip with the command
pip3 install pyvmomifor the latest available version. -
Add the required fields in the
config.jsonfile, mainly the HOST, USER and PASS, if you need to change the PORT this can be done also through the file and the TIME field is set in minutes and by default is set at 1 minute. -
The Python script can be tested manually by running the script and watching the resulting logs coming through the shell. Note that this script pulls information from a specific point in time.
$ python3 remote-vcenter.py
| Because the script connects to vCenter remotely, we recommend setting up a dedicated user in vCenter as a security measure. |
This configuration uses the im_exec module to run the Python script and accept logs from its standard output. The xm_json module is used to parse the JSON event data.
<Extension _json>
    Module  xm_json
</Extension>

<Input inbound>
    Module     im_exec
    Command    /usr/bin/python3
    Arg        /opt/nxlog/etc/vmware-poll.py
    <Exec>
        if $raw_event =~ /^Starting poll/ {
            log_info($raw_event);
            drop();
        } else if $raw_event =~ /^No events/ {
            log_info($raw_event);
            drop();
        } else {
            parse_json();
        }
    </Exec>
</Input>

<Output results>
    Module     om_file
    File       "/tmp/results.json"
</Output>{
"CreatedTime": "2021-12-04 03:37:24.638000+00:00",
"Username": "VSPHERE.LOCAL\Administrator",
"FullMessage": "User VSPHERE.LOCAL\Administrator@192.168.88.218 logged out (login time: Saturday, 04 December, 2021 03:05:43 AM, number of API invocations: 4, user agent: pyvmomi Python/3.9.4 (Windows; 10; AMD64))"
}
{
"CreatedTime": "2021-12-04 03:37:25.292999+00:00",
"Username": "VSPHERE.LOCAL\Administrator",
"FullMessage": "User VSPHERE.LOCAL\Administrator@192.168.88.167 logged out (login time: Saturday, 04 December, 2021 03:05:43 AM, number of API invocations: 4, user agent: pyvmomi Python/3.7.3 (Linux; 4.19.0-18-amd64; x86_64))"
}
{
"CreatedTime": "2021-12-04 03:37:28.381000+00:00",
"Username": "VSPHERE.LOCAL\Administrator",
"FullMessage": "User VSPHERE.LOCAL\Administrator@192.168.88.167 logged in as pyvmomi Python/3.7.3 (Linux; 4.19.0-18-amd64; x86_64)"
}
{
"CreatedTime": "2021-12-04 03:36:40.442999+00:00",
"Username": "VSPHERE.LOCAL\Administrator",
"FullMessage": "User VSPHERE.LOCAL\Administrator@192.168.88.218 logged in as pyvmomi Python/3.9.4 (Windows; 10; AMD64)"
}# Reference to the original Python script can be found
# at: https://copdips.com/2018/07/use-pyvmomi-EventHistoryCollector-to-get-all-the-vcenter-events.html
import json
import time
from datetime import datetime, timedelta
from pyVim.connect import SmartConnectNoSSL
from pyVmomi import vim
with open("config.json") as json_configuration:
configuration = json.load(json_configuration)
controller = True
while controller == True:
time_filter = vim.event.EventFilterSpec.ByTime()
now = datetime.now()
time_filter.beginTime = now - timedelta(minutes=int(configuration["TIME"]))
time_filter.endTime = now
# If you want to also filter on certain events, uncomment the below event_type_list.
# event_type_list = ['VmRelocatedEvent', 'DrsVmMigratedEvent', 'VmMigratedEvent']
event_type_list = []
filter_spec = vim.event.EventFilterSpec(eventTypeId=event_type_list, time=time_filter)
# SmartConnectNoSSL does use a secure connection but does not verify the validity of the certificate
si = SmartConnectNoSSL(host=configuration['HOST'], user=configuration['USER'], pwd=configuration['PASS'],
port=configuration['PORT'])
eventManager = si.content.eventManager
event_collector = eventManager.CreateCollectorForEvents(filter_spec)
page_size = 1000 # The default and also the max event number per page till vSphere v6.5, you can change it to a smaller value by SetCollectorPageSize().
events = []
print("Starting poll at: %s" % str(now))
while True:
# If there's a huge number of events in the expected time range, this while loop will take a while.
events_in_page = event_collector.ReadNextEvents(page_size)
num_event_in_page = len(events_in_page)
if num_event_in_page == 0:
break
events.extend(events_in_page) # or do other things on the collected events
# Please note that the events collected are not ordered by the event creation time, you might find the first event in the third page for example.
if events == 0:
print("No events on the host system during the time period specified")
else:
for item in events:
result = '"CreatedTime": "{0}", "Username": "{1}", "FullMessage": "{2}"'.format(str(item.createdTime), item.userName.replace("\\","\\\\"), item.fullFormattedMessage.replace("\\","\\\\"))
# Reference on how to remove buffering in order to print the information constantly instead of waiting for the
# buffer to fill-up: https://stackoverflow.com/questions/54867515/pyserial-updates-too-slow?noredirect=1&lq=1
print("{"+result+"}", flush=True)
time.sleep(int(configuration["TIME"])*60)VCSA (vCenter Server Appliance) method for log forwarding
The method shown below is only available on the Linux-based version of VMware vCenter, it does not apply and cannot be done on the Windows-based version.
While TCP and UDP can be used it is recommended to implement TLS as it ensures that sensitive information is encrypted in transit.
-
Log in to the Appliance Management UI with a user that has administrator rights.
-
The above can be done with
https://<ip_address_of_vcsa>:5480. -
Look for the Syslog option on the left side menu and click on it.
-
Under the Forwarding Configuration screen select Edit.
-
Add the Server Address and Port to be used. We will be using port 6514 for our example.
-
For Protocol select TLS.
-
Click on Save.
-
Log through SSH, note that you may need to configure Shell access to the platform through the Appliance Management UI.
-
On the left side menu click on Access, on the right side of the Access Settings screen click on Edit.
-
Allow BASH access and add a timeout for the method.
-
Connect to your VCSA through SSH and access through Bash by typing shell.
-
Elevate your user to root and move to
/etc/vmware/vmware-vmafd. -
Copy the files found here ca.crt, machine-ssl.crt and machine-ssl.key to the machine where we have NXLog installed.
-
Add these files to the certificates folder on NXLog, the location of this folder varies depending on the type of OS.
In this example, a configuration is provided for the reception of logs, it assumes that the host machine is Linux based on the location of the output file.
<Extension _syslog>
    Module  xm_syslog
</Extension>

<Extension _json>
    Module  xm_json
</Extension>

<Input vmware_tls>
    Module      im_ssl
    ListenAddr  0.0.0.0:6514
    CAFIle      %CERTDIR%/ca.crt
    CertFile    %CERTDIR%/machine-ssl.crt
    CertKeyFile %CERTDIR%/machine-ssl.key
</Input>

<Output vmware_json>
    Module      om_file
    File        "/tmp/vmware.json"
    <Exec>
        parse_syslog();
        to_json();
    </Exec>
</Output>{"MessageSourceAddress":"192.168.88.173","EventReceivedTime":"2021-12-01T19:21:56.986288-08:00","SourceModuleName":"vmware_tls","SourceModuleType":"im_ssl","SyslogFacilityValue":1,"SyslogFacility":"USER","SyslogSeverityValue":6,"SyslogSeverity":"INFO","SeverityValue":2,"Severity":"INFO","Hostname":"photon-machine","EventTime":"2021-12-01T19:21:55.975967-08:00","Message":" 2021-12-02T03:21:55:975Z 'VcIntegrity' 140425177614080 INFO [vcIntegrity, 1526] Getting IP Address from host name: photon-machine","SourceName":"updatemgr"}
{"MessageSourceAddress":"192.168.88.173","EventReceivedTime":"2021-12-01T19:21:57.002266-08:00","SourceModuleName":"vmware_tls","SourceModuleType":"im_ssl","SyslogFacilityValue":1,"SyslogFacility":"USER","SyslogSeverityValue":6,"SyslogSeverity":"INFO","SeverityValue":2,"Severity":"INFO","Hostname":"photon-machine","EventTime":"2021-12-01T19:21:55.990930-08:00","Message":" 2021-12-02T03:21:55:990Z 'VcIntegrity' 140425177614080 INFO [vcIntegrity, 1543] Cannot get IP address for host name: photon-machine","SourceName":"updatemgr"}
{"MessageSourceAddress":"192.168.88.173","EventReceivedTime":"2021-12-01T19:22:04.987395-08:00","SourceModuleName":"vmware_tls","SourceModuleType":"im_ssl","SyslogFacilityValue":9,"SyslogFacility":"CRON","SyslogSeverityValue":6,"SyslogSeverity":"INFO","SeverityValue":2,"Severity":"INFO","Hostname":"photon-machine","EventTime":"2021-12-01T19:22:03.550483-08:00","Message":" (root) CMD ( test -x /usr/sbin/vpxd_periodic && /usr/sbin/vpxd_periodic >/dev/null 2>&1)","SourceName":"CROND","ProcessID":10579}
{"MessageSourceAddress":"192.168.88.173","EventReceivedTime":"2021-12-01T19:22:04.989626-08:00","SourceModuleName":"vmware_tls","SourceModuleType":"im_ssl","SyslogFacilityValue":9,"SyslogFacility":"CRON","SyslogSeverityValue":6,"SyslogSeverity":"INFO","SeverityValue":2,"Severity":"INFO","Hostname":"photon-machine","EventTime":"2021-12-01T19:22:03.552604-08:00","Message":" (root) CMD (. /etc/profile.d/VMware-visl-integration.sh; /usr/lib/applmgmt/backup_restore/scripts/SchedulerCron.py >>/var/log/vmware/applmgmt/backupSchedulerCron.log 2>&1)","SourceName":"CROND","ProcessID":10580}
{"MessageSourceAddress":"192.168.88.173","EventReceivedTime":"2021-12-01T19:22:11.357615-08:00","SourceModuleName":"vmware_tls","SourceModuleType":"im_ssl","SyslogFacilityValue":3,"SyslogFacility":"DAEMON","SyslogSeverityValue":6,"SyslogSeverity":"INFO","SeverityValue":2,"Severity":"INFO","Hostname":"photon-machine","EventTime":"2021-12-01T19:22:11.363680-08:00","Message":" Time has been changed","SourceName":"systemd","ProcessID":1}