
Send logs to Splunk
Splunk is a log collection, indexing, analysis, and visualization platform. It is available in two editions, the on-premises Splunk Enterprise, and the cloud-based Splunk Cloud Platform.
NXLog Agent can send logs to Splunk via UDP, TCP with TLS, and HTTP(S). You can collect logs with NXLog Agent from diverse log sources, including Windows, Linux, and macOS, and send them directly to Splunk. Alternatively, you can use NXLog Agent as a relay, receiving logs from different network sources and forwarding them to Splunk from a single instance or an NXLog Agent cluster. NXLog Agent’s advanced log collection, processing, and forwarding capabilities make it the ideal log collector for Splunk SIEM.
A Splunk Universal Forwarder alternative
The Splunk Universal Forwarder is a Splunk agent commonly used in a similar role as NXLog Agent. However, NXLog Agent offers some significant advantages over the Splunk forwarder, including full-featured log parsing and filtering before forwarding, which results in faster indexing by Splunk. In controlled tests, Splunk indexers processed events forwarded by NXLog Agent over ten times faster than the same Windows events forwarded by the Splunk Universal Forwarder, despite the overhead of transforming the events to emulate Splunk’s proprietary format.
When planning a migration to NXLog Agent, you should first evaluate the log formats you’re collecting with the Splunk Universal Forwarder. Depending on the type of logs, it could be as simple as creating a new Splunk TCP data input and following some of the examples in this guide, such as forwarding IETF syslog or JSON formats. You do not need to create any special configuration as long as the logs are in a standard format that Splunk can parse and index.
Configure Splunk Enterprise to receive logs
Splunk Enterprise accepts logs via UDP, TCP, and HTTP(S). The following sections describe how to prepare Splunk for receiving logs from NXLog Agent.
Splunk UDP and TCP data inputs
You can configure UDP and TCP inputs from Splunk Web. However, you can only configure TLS encryption by editing Splunk configuration files.
-
Add a new data input.
-
Open Splunk Web and navigate to Settings > Data inputs.
-
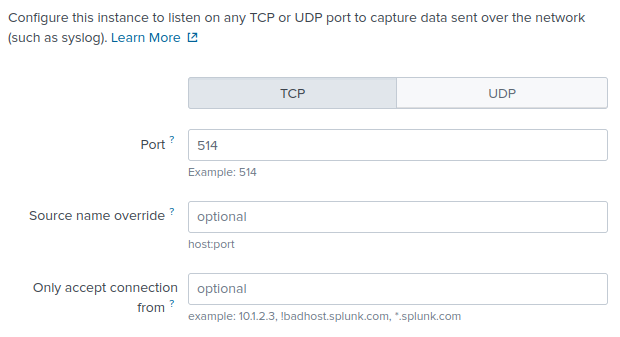
In the Local inputs section, click Add new for the TCP (or UDP) input type.
-
Enter the Port on which to listen for log data (for example, port 514).
-
Fill in the remaining values if required and click Next.
-
-
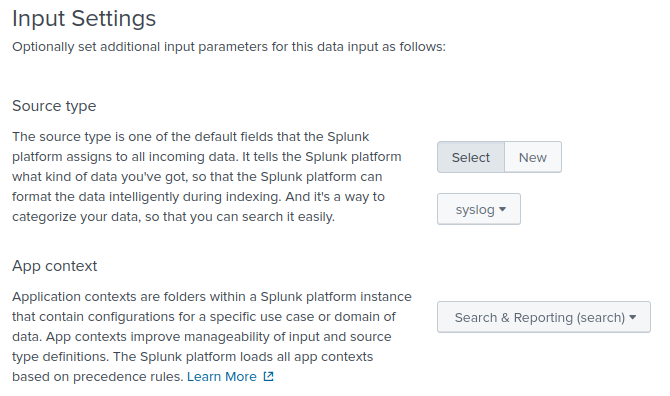
Configure the input settings.
-
Select the appropriate log Source type. See the examples in Configure NXLog Agent to collect and process logs for more information.
-
Choose an App context; for example, Search & Reporting (search).
-
Adjust the remaining default values, if required, and click Review.
-
-
Review the pending changes and click Submit.
Splunk HTTP Event Collector (HEC)
The HTTP Event Collector is a stateless, high-performance solution that is easy to scale with a load balancer. Furthermore, it offers token-based authentication. For more information about configuring and using Splunk HEC, see Setup and use HTTP Event Collector in Splunk Web, Format events for HTTP Event Collector, and Input endpoint descriptions in the Splunk documentation.
By default, HEC is turned off on Splunk Enterprise installations. Follow these steps to configure it:
-
Navigate to Settings > Data inputs and click on the HTTP Event Collector type.
-
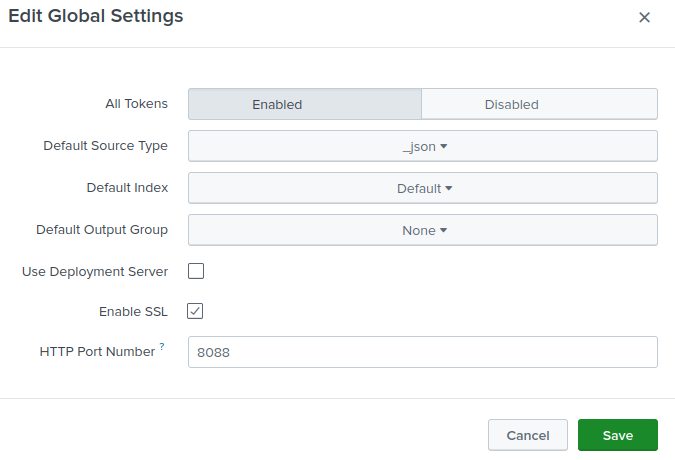
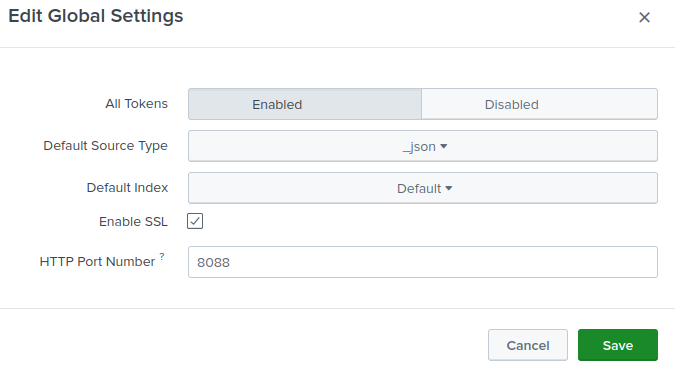
Click the Global Settings button (in the upper-right corner).
-
For All Tokens, click the Enabled button.
-
Optionally, set the Default Source Type, Default Index, and Default Output Group settings.
-
Check Enable SSL to enforce secure data transfer (recommended). See Configure TLS on Splunk Enterprise.
-
Change the HTTP Port Number if required.
-
Click Save.
Once you configure HEC, create a new token as follows:
-
If not already on the HTTP Event Collector page, open Settings > Data inputs and click on the HTTP Event Collector type.
-
Click New Token.
-
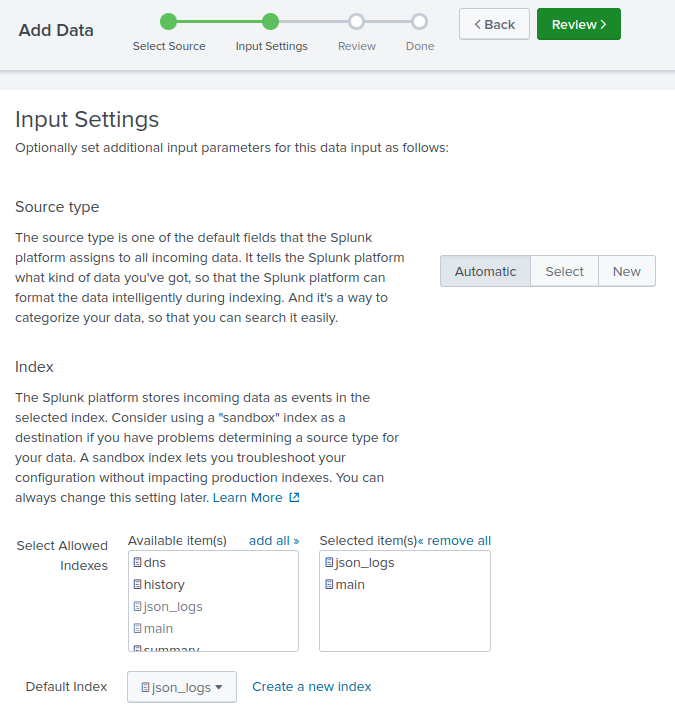
Enter a name for the token and modify any other settings if required; then click Next.
-
For the Source type, choose Automatic. The source type will be included with the event metadata, as shown in the examples below.
-
Adjust the remaining default values if required and click Review.
-
Verify the information on the summary page and click Submit. Take note of the HEC token. You will need this to configure NXLog Agent.
-
Use the following command to verify your new HEC input. Replace
<host>with your Splunk hostname or IP and<token>with your HEC token.$ curl -k https://<host>:8088/services/collector \ -H 'Authorization: Splunk <token>' -d '{"event":"test"}'If configured correctly, Splunk will return a successful response.
{"text":"Success","code":0}
Configure TLS on Splunk Enterprise
Splunk Enterprise 6.6 and newer installations include default self-signed certificates. Follow these steps to configure your Splunk inputs to use TLS. You will need:
-
The Splunk CA certificate (
cacert.pem) -
The Splunk server certificate (
server.pem) -
The Splunk server certificate key password (
passwordby default)
If you are using the default Splunk certificates, you can locate these files in $SPLUNK_HOME/etc/auth.
-
Add the
sslRootCAPathparameter to the[sslConfig]stanza in the$SPLUNK_HOME/etc/system/local/server.conffile as follows:server.conf[sslConfig] sslPassword = <Automatically generated> sslRootCAPath = /opt/splunk/etc/auth/cacert.pem -
Add
[tcp-ssl]and[SSL]stanzas to theinputs.conffile of the relevant Splunk app(s). For example, the Search & Reporting app path is$SPLUNK_HOME/etc/apps/search/local.inputs.conf[tcp-ssl://10514] disabled = 0 sourcetype = <optional> [SSL] serverCert = /opt/splunk/etc/auth/server.pem sslPassword = password requireClientCert = 0Splunk HEC inherits SSL settings from the global server.conf. Therefore, you do not need to set SSL configuration for HEC inputs. -
Finally, restart Splunk to apply the new configuration.
$ sudo $SPLUNK_HOME/bin/splunk restart -
Test your configuration with
netstator a similar command. If configured correctly, the command should list the TCP port you specified in step 2.$ netstat -an | grep :10514 tcp 0 0 0.0.0.0:10514 0.0.0.0:* LISTEN -
Copy
cacert.pemfrom$SPLUNK_HOME/etc/authto the NXLog Agent certificates directory.
Configure Splunk Cloud Platform to receive logs
Splunk Cloud Platform accepts logs via HTTP Event Collector (HEC) inputs. HEC is turned on by default with a 1 MB content length limit. Follow these steps to verify that HEC is turned on for your instance:
-
Navigate to Settings > Data inputs and click on the HTTP Event Collector type.
-
Click the Global Settings button (in the upper-right corner).
-
For All Tokens, click the Enabled button.
-
Optionally, set the Default Source Type and Default Index settings.
-
Check Enable SSL to require secure data transfer (recommended).
-
Change the HTTP Port Number if needed.
-
Click Save.
| You cannot modify HEC SSL and port options on Splunk Cloud Platform trial instances. |
Export the Splunk Cloud Platform CA certificate
- Exporting the CA certificate using OpenSSL
-
-
Execute the following command:
$ openssl s_client -showcerts -connect <your_instance_url>:<your_hec_port> < /dev/nullReplace
<your_instance_url>with your Splunk Cloud Platform instance URL and<your_hec_port>with the HTTP port number you specified when you created the HEC input. For example:$ openssl s_client -showcerts -connect prd-p-5tzek.splunkcloud.com:8088 < /dev/null -
The information returned will contain the complete certificate chain. Copy the last certificate shown, including the
-----BEGIN CERTIFICATE-----and-----END CERTIFICATE-----lines, to a text file. If the response contains more than two certificates, copy all the certificates except the first one to the same text file. -
Save the file to a directory accessible by NXLog Agent.
-
- Exporting the CA certificate from Chrome on Windows
-
-
Open Chrome, and enter your Splunk Cloud Platform instance URL, including the HEC port, in the address bar. For example,
https://prd-p-5tzek.splunkcloud.com:8088/. -
Click on the padlock icon next to the URL in the browser address bar. If the browser shows that your connection is not private, click on the
Not securewarning instead. -
Click Certificate is valid or Certificate is not valid.
-
Select the topmost certificate on the Details tab and click the Export button. If more than two certificates are displayed, select the one before the last.
-
Select the Base-64 encoded ASCII, certificate chain (*.pem;*.crt) option.
-
Select the directory where to save the certificate and click Save.
-
The procedure to export certificates differs according to the browser and operating system. Refer to your browser documentation for the appropriate steps.
Configure NXLog Agent to collect and process logs
Forward generic logs in JSON format
For Splunk to parse JSON logs, you simply need to set the data input source type to _json.
See how to configure Splunk Enterprise and Splunk Cloud Platform above.
Furthermore, configure the data input or source type with NXLog Agent’s integer timestamp format to ensure that Splunk parses the event timestamp correctly.
To modify the _json source type from Splunk Web:
-
Navigate to Settings > Source types.
-
Find the` _json` source type and click Edit.
-
Open the Advanced tab and add the following configuration value:
Name Value TIME_PREFIX"time":"TIME_FORMAT%s.%6N
This configuration collects syslog messages from a file with the im_file input module.
First, it parses the log records to structured data using the parse_sylog() of the xm_syslog module.
It then creates a $time field containing the event’s integer timestamp.
Finally, it converts the log record to JSON using the to_json() procedure of the xm_json module.
<Extension json>
    Module    xm_json
</Extension>

<Extension syslog>
    Module    xm_syslog
</Extension>

<Input syslog_file>
    Module    im_file
    File      '/var/log/syslog'
    <Exec>
        # Parse the log record into fields
        parse_syslog();

        # Convert $EventTime to decimal seconds since epoch UTC
        $time = string(integer($EventTime));
        $time =~ /^(?<sec>\d+)(?<ms>\d{6})$/;
        $time = $sec + "." + $ms;
        delete($sec);
        delete($ms);

        # Convert to JSON
        to_json();
    </Exec>
</Input>{
"EventReceivedTime": "2023-02-01T05:36:59.448973+00:00",
"SourceModuleName": "syslog",
"SourceModuleType": "im_file",
"SyslogFacility": "USER",
"vendor_severity": "INFO",
"severity_id": 2,
"EventTime": "2023-02-01T05:36:58.190689+00:00",
"Hostname": "NXLog-Ubuntu-1",
"ProcessID": 14533,
"SourceName": "sshd",
"Message": "Failed password for invalid user",
"time": "1675229818.190689"
}Forward Windows logs in JSON format
This section assumes that you will manage any pre-existing Windows logs in Splunk separately until they age out of the system. This is because Splunk alters some of the original Windows field names. However, if you need to maintain Splunk-specific field names for Windows logs, see Forward Windows logs in the Splunk Universal Forwarder format below.
This configuration uses the im_etw input module to collect logs from the Microsoft-Windows-DNSServer ETW provider.
It then converts log records to JSON format using the to_json() procedure of the xm_json module.
<Extension json>
    Module      xm_json
</Extension>

<Input dns_server>
    Module      im_etw
    Provider    Microsoft-Windows-DNSServer
    Exec        to_json();
</Input>{
"SourceName": "Microsoft-Windows-DNSServer",
"ProviderGuid": "{EB79061A-A566-4698-9119-3ED2807060E7}",
"EventID": 515,
"Version": 0,
"ChannelID": 17,
"OpcodeValue": 0,
"TaskValue": 5,
"Keywords": "4611686018428436480",
"EventTime": "2020-05-19T10:42:06.313322-05:00",
"ExecutionProcessID": 1536,
"ExecutionThreadID": 3896,
"EventType": "INFO",
"SeverityValue": 2,
"Severity": "INFO",
"Domain": "WIN-R4QHULN6KLH",
"AccountName": "Administrator",
"UserID": "S-1-5-21-915329490-2962477901-227355065-500",
"AccountType": "User",
"Flags": "EXTENDED_INFO|IS_64_BIT_HEADER|PROCESSOR_INDEX (577)",
"Type": "5",
"NAME": "www.example.com",
"TTL": "3600",
"BufferSize": "17",
"RDATA": "0x106E73312E6578616D706C652E636F6D2E",
"Zone": "example.com",
"ZoneScope": "Default",
"VirtualizationID": ".",
"EventReceivedTime": "2020-05-19T10:42:07.313482-05:00",
"SourceModuleName": "dns_server",
"SourceModuleType": "im_etw",
"MessageSourceAddress": "192.168.1.61"
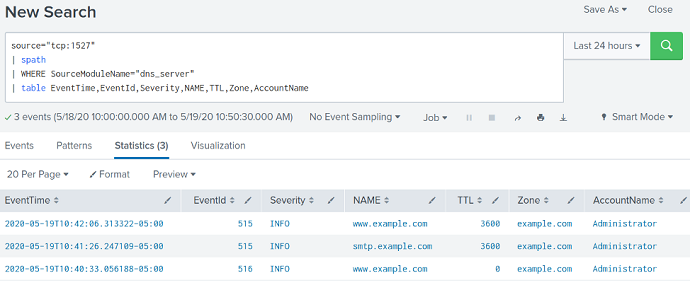
}You can send JSON-formatted logs to a data input configured with automatic or _json source type, and Splunk will parse and index them.
For example, the screenshot below shows a query in Splunk Web that uses the spath command to retrieve the DNS Server logs forwarded by NXLog Agent.
Forward Windows logs in XML format
The Splunk Add-on for Microsoft Windows provides log source types for parsing Windows logs in XML format. Follow these steps to configure a Splunk data input to parse Windows XML logs:
-
Install the Splunk Add-on for Microsoft Windows. See About installing Splunk add-ons in the Splunk documentation for more details.
-
Set the log source type of your data input to XmlWinEventLog.
-
Optionally, configure the data input or event source to use the record’s
SystemTimevalue for Splunk’s event_timefield during indexing. Otherwise, Splunk will default to using the ingestion time. To modify the XmlWinEventLog source type from Splunk Web:-
Navigate to Settings > Source types.
-
Find the XmlWinEventLog source type (deselect the Show only popular option) and click Edit.
-
Open the Advanced tab and add the following configuration value:
Name Value EVAL-_timestrptime(SystemTime, "'%Y-%m-%dT%H:%M:%S.%9N%Z'")
-
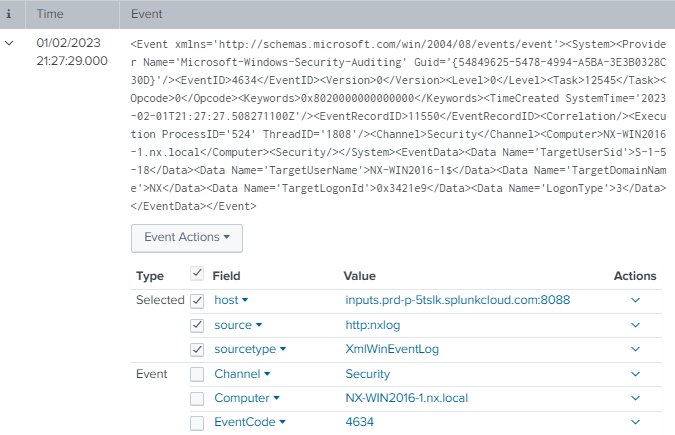
This configuration uses the im_msvistalog input module with the CaptureEventXML directive set to TRUE.
It then sets the $raw_event field to the value of the $EventXML field.
<Input windows_security>
    Module             im_msvistalog
    Channel            Security
    CaptureEventXML    TRUE
    Exec               $raw_event = $EventXML;
</Input>
Splunk will automatically parse and index the logs, as shown in the screenshot below.
Forward Windows logs in the Splunk Universal Forwarder format
The Splunk Universal Forwarder renames at least four fields and adds several new ones to Windows logs. Therefore specific NXLog Agent configuration is required to emulate this event schema. See the comparison table below.
| Windows | NXLog Agent | Splunk |
|---|---|---|
|
|
|
|
|
|
|
|
|
|
|
|
|
|
|
|
|
|
|
|
|
|
|
|
|
|
|
* NXLog Agent normalizes this field name across all modules and log sources.
| It should be emphasized that NXLog Agent can forward Windows or any other kind of structured logs to Splunk without any need to emulate the Splunk Universal Forwarder format or schema. There is no technical requirement or advantage in using Splunk’s proprietary format to forward logs to Splunk, especially for new Splunk deployments with no existing corpus of Windows event logs. |
The only purpose of emulating the Splunk Universal Forwarder format is to maintain continuity with previously indexed Windows events. Therefore, the preferred method is to forward Windows logs to Splunk in JSON format.
If it is essential to retain the Splunk Universal Forwarder format after migrating to NXLog Agent, then adhering to the following procedures is imperative for Splunk to ingest the emulated logs correctly.
There are a few principles you need to observe when creating an NXLog Agent configuration that maintains backward compatibility with events collected by the Splunk Universal Forwarder:
-
When creating a new TCP data input in Splunk, you must choose the correct Source Type.
-
In the NXLog Agent configuration, rename fields to what Splunk associates with that Source Type.
-
In the NXLog Agent configuration, ensure the data matches the format shown in Splunk as closely as possible unless Splunk fails to parse specific fields.
-
In the NXLog Agent configuration, manually parse embedded structured data as new, full-fledged fields. When using this technique, a common cause of parsing failure is fields containing strings of embedded fields.
Follow these steps for each log source type you are forwarding:
-
Examine the events in Splunk and note the
sourcetypevalue listed below each event. The Splunk Universal Forwarder may assign differentsourcetypevalues for logs from the samesource. Try to determine which one is the best fit. -
In Splunk, create a new TCP Data Input port for each log source type to be forwarded. Set the Source Type to the same value assigned to events received from the Splunk Universal Forwarder.
-
Note which fields Splunk parses after indexing the logs.
-
Create an NXLog Agent configuration that collects the logs, renames the fields to those associated with the relevant Source Type, and rewrites the records to match the Splunk Universal Forwarder format.
The Splunk Universal Forwarder format, called "cooked data," includes a binary header component and a footer.
A log record starts with a line containing the event’s timestamp.
The timestamp is followed by a set of unquoted key-value pairs separated by an equals sign (=), one key-value pair per line.
The header and footer are not required to forward logs to a TCP Data Input.
Instead, you only need to send the first line containing the event’s timestamp and the subsequent lines containing the key-value pairs.
You can forward Windows logs from NXLog Agent so that Splunk parses and indexes them as if the Splunk Universal Forwarder sent them. There are only three criteria you must meet:
-
Install the Splunk Add-on for Microsoft Windows on the Splunk instance receiving the logs. See About installing Splunk add-ons in the Splunk documentation for more details.
-
Configure NXLog Agent to rewrite log records to match the field names expected by the corresponding log source in the Splunk Add-on for Microsoft Windows.
-
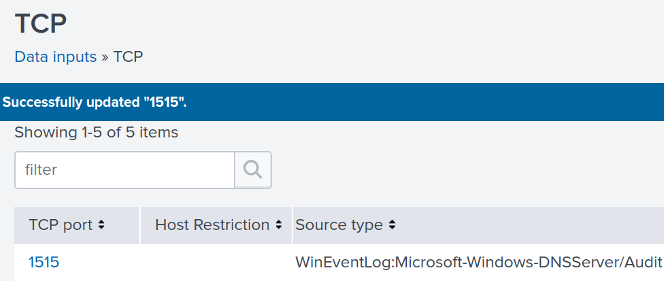
Create a unique TCP Data Input port for each type of Windows log provider by following the procedure in Splunk UDP and TCP data inputs above. It is imperative to specify the correct Source type following this naming convention:
WinEventLog:Provider/Channel.
| When adding a new TCP Data Input, the desired Source type for Windows might not be available in the Select Source Type dropdown menu. If so, select or manually enter WinEventLog. Once you create the TCP Data Input, go back to edit it, select Manual for Set source type, and enter the correct value in the Source type field. |
This example illustrates the method for emulating the Splunk Universal Forwarder sending Windows DNS Server audit logs to Splunk.
The first step is to create a new data input with a Source type of WinEventLog:Microsoft-Windows-DNSServer/Audit.
This configuration uses the im_msvistalog module to collect and parse the logs.
Since there is no need for filtering in this example, a simple File directive defines the location of the log source.
Otherwise, use the Channel directive with a QueryXML block to specify filters.
Next, the Exec block contains the logic for converting log records to the Splunk Universal Forwarder format.
Finally, the configuration sets the $raw_event field to the multiline string containing the event data and uses the xm_rewrite to delete the original fields.
<Extension drop_fields>
Module xm_rewrite
Keep # Remove all
</Extension>
<Input dns_server_audit>
Module im_msvistalog
File %SystemRoot%\System32\Winevt\Logs\Microsoft-Windows-DNSServer%4Audit.evtx
<Exec>
# Create a header variable for storing the Splunk datetime string
create_var('timestamp_header');
create_var('event'); # The Splunk equivalent of a $raw_event
create_var('message'); # For preserving the $Message field
create_var('vip_fields'); # Message subfields converted to fields
# Format the datetime string for the Header Line
$dts = strftime($EventTime,'YYYY-MM-DD hh:mm:ss.sTZ');
$hr = ""; # Hours, 2-digit
$ap = ""; # For either "AM" or "PM";
if ($dts =~ /(\d{4})-(\d{2})-(\d{2}) (\d{2}):(\d{2}):(\d{2})/ ) {
if (hour($EventTime) < 12) {
$ap = "AM";
$hr = $4;
if (hour($EventTime) == 0) $hr = "12";
}
if (hour($EventTime) > 11) {
$ap = "PM";
if (hour($EventTime) == 12) $hr = $4;;
if (hour($EventTime) > 12) {
$hr = hour($EventTime) - 12;
if (hour($EventTime) < 22) $hr = "0" + $hr;
}
}
$dts = $2 +"/"+ $3 +"/"+ $1 +" "+ \
$hr +":"+ $5 +":"+ $6 +" "+ $ap + "\n";
}
set_var('timestamp_header', $dts);
# Convert $EventType to the Splunk equivalent
$EventType = ($EventType == "INFO" ? 4 : $EventType);
# Some really important DNS fields that Splunk doesn't parse
$vipFields = "";
if (defined($NAME))
$vipFields = $vipFields + 'NAME=' + $NAME + "\r\n";
if (defined($Severity))
$vipFields = $vipFields + 'Severity=' + $Severity + "\r\n";
if (defined($TTL))
$vipFields = $vipFields + 'TTL=' + $TTL + "\r\n";
if (defined($BufferSize))
$vipFields = $vipFields + 'BufferSize=' + $BufferSize + "\r\n";
if (defined($RDATA))
$vipFields = $vipFields + 'RDATA=' + $RDATA + "\r\n";
if (defined($Zone))
$vipFields = $vipFields + 'Zone=' + $Zone + "\r\n";
if (defined($ZoneScope))
$vipFields = $vipFields + 'ZoneScope=' + $ZoneScope + "\r\n";
set_var('vip_fields', $vipFields);
# Store the original $Message field at the end of the list
# just in case Splunk parses it correctly
set_var('message', $Message);
# Set the event data in the Splunk format
set_var('event', \
'LogName=' + $Channel +"\r\n"+ \
'SourceName=' + $SourceName +"\r\n"+ \
'EventCode=' + $EventID +"\r\n"+ \
'EventType=' + $EventType +"\r\n"+ \
'Type=' + 'Information' +"\r\n"+ \
'ComputerName=' + $Hostname +"\r\n"+ \
'User=' + 'NOT_TRANSLATED' +"\r\n"+ \
'Sid=' + $UserID +"\r\n"+ \
'SidType=' + '0' +"\r\n"+ \
'TaskCategory=' + $Category +"\r\n"+ \
'OpCode=' + $OpCode +"\r\n"+ \
'RecordNumber=' + $RecordNumber +"\r\n"+ \
'Keywords=' + $Keywords +"\r\n" \
);
# Remove all NXLog fields.
drop_fields->process();
# Add the Splunk datetime string as a "header" line
$raw_event = get_var('timestamp_header') + get_var('event') + \
get_var('vip_fields') + 'Message=' + get_var('message') +"\n";
</Exec>
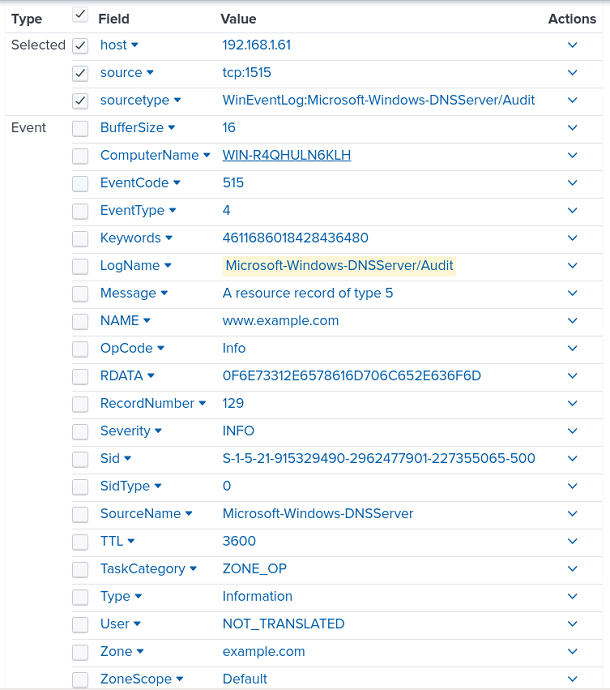
</Input>The following is a sample DNS Server audit log record ingested by Splunk.
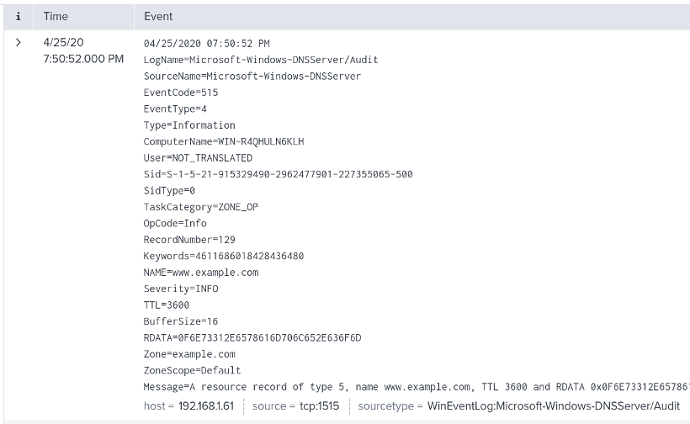
Splunk will automatically parse and index the logs, as shown in the screenshot below.
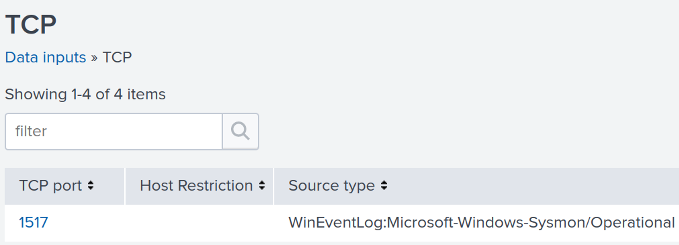
This example illustrates the method for emulating the Splunk Universal Forwarder sending Windows Sysmon DNS Query logs to Splunk.
The first step is to create a new data input with a Source type of WinEventLog:Microsoft-Windows-Sysmon/Operational.
This configuration uses the im_msvistalog module to collect and parse the logs.
The QueryXML block specifies the Sysmon provider and filters for DNS Query logs.
Next, the Exec block contains the logic for converting log records to the Splunk Universal Forwarder format.
Finally, the configuration sets the $raw_event field to the multiline string containing the event data and uses the xm_rewrite to delete the original fields.
<Extension drop_fields>
Module xm_rewrite
Keep # Remove all
</Extension>
<Input dns_sysmon>
Module im_msvistalog
<QueryXML>
<QueryList>
<Query Id="0">
<Select Path="Microsoft-Windows-Sysmon/Operational">
*[System[(EventID=22)]]
</Select>
</Query>
</QueryList>
</QueryXML>
<Exec>
# Create a header variable for storing the Splunk datetime string
create_var('timestamp_header');
create_var('event'); # The Splunk equivalent of a $raw_event
create_var('message'); # For preserving the $Message field
create_var('message_fields'); # Message subfields converted to fields
# Format the datetime string for the Header Line
$dts = strftime($EventTime,'YYYY-MM-DD hh:mm:ss.sTZ');
$hr = ""; # Hours, 2-digit
$ap = ""; # For either "AM" or "PM";
if ($dts =~ /(\d{4})-(\d{2})-(\d{2}) (\d{2}):(\d{2}):(\d{2})/ ) {
if (hour($EventTime) < 12) {
$ap = "AM";
$hr = $4;
if (hour($EventTime) == 0) $hr = "12";
}
if (hour($EventTime) > 11) {
$ap = "PM";
if (hour($EventTime) == 12) $hr = $4;;
if (hour($EventTime) > 12) {
$hr = hour($EventTime) - 12;
if (hour($EventTime) < 22) $hr = "0" + $hr;
}
}
$dts = $2 +"/"+ $3 +"/"+ $1 +" "+ \
$hr +":"+ $5 +":"+ $6 +" "+ $ap + "\n";
}
set_var('timestamp_header', $dts);
# Convert $EventType to the Splunk equivalent
$EventType = ($EventType == "INFO" ? 4 : $EventType);
# Since Splunk often fails to parse the sub-fields of the Sysmon
# $Message field, create them as individual fields
$Subfields = "";
if (defined($UtsTime))
$Subfields = $Subfields + 'UtcTime=' + $UtcTime + "\r\n";
if (defined($ProcessGuid))
$Subfields = $Subfields + 'ProcessGuid=' + $ProcessGuid + "\r\n";
if (defined($ProcessId))
$Subfields = $Subfields + 'ProcessId=' + $ProcessId + "\r\n";
if (defined($QueryName))
$Subfields = $Subfields + 'QueryName=' + $QueryName + "\r\n";
if (defined($QueryStatus))
$Subfields = $Subfields + 'QueryStatus=' + $QueryStatus + "\r\n";
if (defined($QueryResults))
$Subfields = $Subfields + 'QueryResults=' + $QueryResults + "\r\n";
if (defined($Image))
$Subfields = $Subfields + 'Image=' + $Image + "\r\n";
set_var('message_fields', $Subfields);
# Store the original $Message field at the end of the list
# just in case Splunk parses it correctly
set_var('message', $Message);
# Set the event data in the Splunk format
set_var('event', \
'LogName=' + $Channel +"\r\n"+ \
'SourceName=' + $SourceName +"\r\n"+ \
'EventCode=' + $EventID +"\r\n"+ \
'EventType=' + $EventType +"\r\n"+ \
'Type=' + 'Information' +"\r\n"+ \
'ComputerName=' + $Hostname +"\r\n"+ \
'User=' + 'NOT_TRANSLATED' +"\r\n"+ \
'Sid=' + $UserID +"\r\n"+ \
'SidType=' + '0' +"\r\n"+ \
'TaskCategory=' + $Category +"\r\n"+ \
'OpCode=' + $OpCode +"\r\n"+ \
'RecordNumber=' + $RecordNumber +"\r\n"+ \
'Keywords=' + $Keywords +"\r\n" \
);
# Remove all NXLog fields.
Drop_Fields->process();
# Add the Splunk datetime string as a "header" line
$raw_event = get_var('timestamp_header') + get_var('event') + \
get_var('message_fields') + 'Message=' + get_var('message') +"\n";
</Exec>
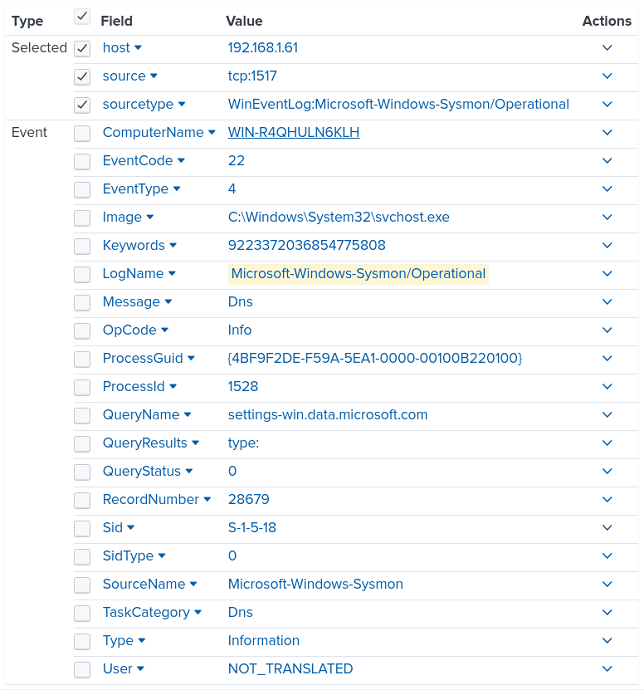
</Input>The following is a sample Sysmon DNS query log record ingested by Splunk:
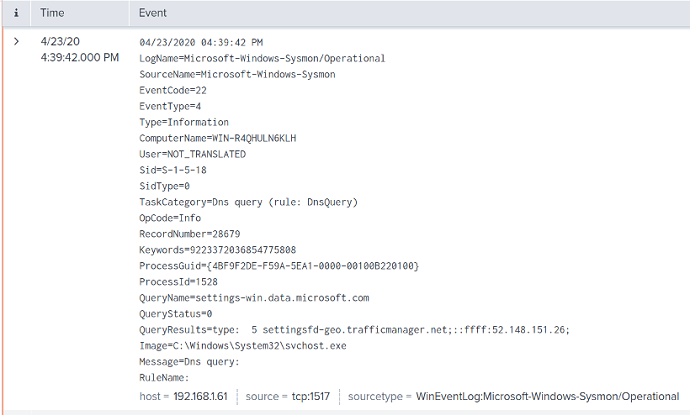
Splunk will automatically parse and index the logs, as shown in the screenshot below.
Forward IETF syslog
For Splunk to parse IETF syslog messages, you simply need to set the data input source type to syslog. See Configure Splunk Enterprise to receive logs above.
This configuration uses the im_systemd input module to collect systemd journal logs. It then uses the to_syslog_ietf() procedure of the xm_syslog module to convert records to IETF syslog format.
<Extension syslog>
    Module    xm_syslog
</Extension>

<Input systemd>
    Module    im_systemd
    Exec      to_syslog_ietf();
</Input>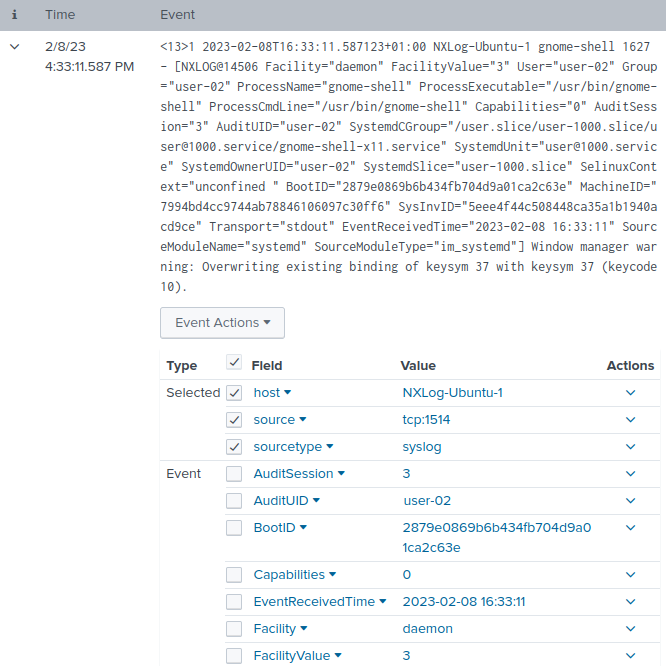
Configure NXLog Agent as a relay
NXLog Agent implements its protocol for optimized log forwarding between NXLog Agent nodes. You can leverage this feature to reduce the number of open network connections to a Splunk Enterprise server or the Splunk Cloud Platform.
In the following configuration, a central NXLog Agent instance receives logs from different sources, caches them to disk, and then forwards all records to a Splunk TCP data input configured to receive logs in JSON format.
<Extension json>
    Module        xm_json
</Extension>

<Extension syslog>
    Module        xm_syslog
</Extension>

# Receive syslog messages from any device
<Input syslog_in>
    Module        im_tcp
    ListenAddr    0.0.0.0:1514
</Input>

# Receive DNS audit logs from another NXLog agent
<Input dns_audit_in>
    Module        im_tcp
    ListenAddr    0.0.0.0:1515
    InputType     Binary
</Input>

# Cache the logs to disk in case Splunk is unavailabe
<Output syslog_cache>
    Module        om_file
    File          '/opt/nxlog/var/log/cached/syslog.bin'
    OutputType    Binary
</Output>

<Output dns_audit_cache>
    Module        om_file
    File          '/opt/nxlog/var/log/cached/dns-audit.bin'
    OutputType    Binary
</Output>

# Read the cached logs from disk
<Input syslog_bin>
    Module        im_file
    File          '/opt/nxlog/var/log/cached/syslog.bin'
    Exec          parse_syslog();
</Input>

<Input dns_audit_bin>
    Module        im_file
    File          '/opt/nxlog/var/log/cached/dns-audit.bin'
</Input>

#Forward cached logs to Splunk in JSON format
<Output splunk_syslog>
    Module        om_tcp
    Host          192.168.1.71:1524
    Exec          to_json();
</Output>

<Output splunk_dns_audit>
    Module        om_tcp
    Host          192.168.1.71:1525
    Exec          to_json();
</Output>

# Routes: TCP received to local files
<Route syslog_tcp_to_cache>
    Path          syslog_in  =>  syslog_cache
</Route>

<Route dns_audit_tcp_to_cache>
    Path          dns_audit_in  =>  dns_audit_cache
</Route>

# Routes: Local files to Splunk
<Route syslog_bin_to_splunk>
    Path          syslog_bin  =>  splunk_syslog
</Route>

<Route dns_audit_bin_to_splunk>
    Path          dns_audit_bin  =>  splunk_dns_audit
</Route>
Configure NXLog Agent to send logs to Splunk
Send logs to Splunk via TCP/TLS
Below, you can find NXLog Agent configuration examples for sending logs to Splunk over plain TCP or securely with TLS.
This configuration uses the om_tcp output module to forward logs to a Splunk TCP data input configured to receive data on port 1514. See Splunk UDP and TCP data inputs for more information.
<Output splunk_tcp>
    Module    om_tcp
    Host      192.168.1.71:1514
</Output>This configuration uses the om_ssl output module to forward logs to a Splunk tcp-ssl input.
The CAFile directive specifies the path to the Splunk CA certificate.
See Configure TLS on Splunk Enterprise for more information.
<Output splunk_tls>
    Module    om_ssl
    Host      192.168.1.71:10514
    CAFile    %CERTDIR%/cacert.pem
</Output>
Send logs to Splunk via HTTP(S)
Splunk accepts data over HTTP(S) via the HTTP Event Collector. Refer to the setup instructions for Splunk Enterprise and Splunk Cloud Platform above.
Splunk HEC provides two endpoints:
-
/services/collector/eventrequires event data to be in a specific JSON format -
/services/collector/rawfor raw text
The Splunk JSON standard consists of the following metadata fields:
-
time(epoch time) -
host -
source -
sourcetype -
index -
fields -
event
The event field must be a JSON object when using the event endpoint or a string when using the raw endpoint.
See Event metadata and Event data in the Splunk documentation for more information.
Since each log record contains the source type, you do not need to configure different Splunk data inputs for each source. Therefore, you can configure multiple NXLog Agent input instances gathering logs from various sources and forwarding them to Splunk from a single output instance.
This configuration uses the HTTP output module to forward logs to a Splunk HEC input and specifies the following directives:
- URL
-
Sends data to the Splunk HEC
eventendpoint. See Send data to HTTP Event Collector on Splunk Cloud Platform in the Splunk documentation for the required URI for your instance.During our testing, http-inputs-<host>.splunkcloud.comdid not work with a Splunk Cloud Platform free trial instance. However,inputs-<host>.splunkcloud.comand<host>.splunkcloud.comdid. - AddHeader
-
Specifies the HEC token value. See Splunk HTTP Event Collector (HEC) above for instructions to create a token.
- HTTPSCAFile
-
The
HTTPSCAFiledirective specifies the path to the Splunk CA certificate. See Configure TLS on Splunk Enterprise for more information. - BatchMode
-
Specifies
multilineto send batched logs in a single HTTP request, one record per line. - Compression
-
Uses
gzipHTTP compression to send data. HEC accepts SSL compression by default. See theallowSslCompressionsetting in the HTTP Event Collector specification.
<Extension json>
    module         xm_json
</Extension>

<Extension clean_splunk_fields>
    Module         xm_rewrite
    Keep           time, host, source, sourcetype, event
    Rename         Source, source
</Extension>

<Output splunk_hec>
    Module         om_http
    URL            https://192.168.1.71:8088/services/collector/event
    AddHeader      Authorization: Splunk c6580856-29e8-4abf-8bcb-ee07f06c80b3
    HTTPSCAFile    %CERTDIR%/cacert.pem
    BatchMode      multiline
    Compression    gzip
    <Exec>
        # Rename event fields to Splunk taxonomy
        if $Severity rename_field($Severity, $vendor_severity);
        if $SeverityValue rename_field($SeverityValue, $severity_id);

        # Convert all fields to JSON and write to $event field
        $event = to_json();

        # Convert $EventTime to decimal seconds since epoch UTC
        $time = string(integer($EventTime));
        $time =~ /^(?<sec>\d+)(?<ms>\d{6})$/;
        $time = $sec + "." + $ms;

        # Set the log source type
        $sourcetype = "_json";

        # Add HEC metadata fields if available
        if $Hostname $host = $Hostname;
        if $SourceName $source = $SourceName;

        # Remove unnecessary fields
        clean_splunk_fields->process();

        # Convert to JSON
        to_json();
    </Exec>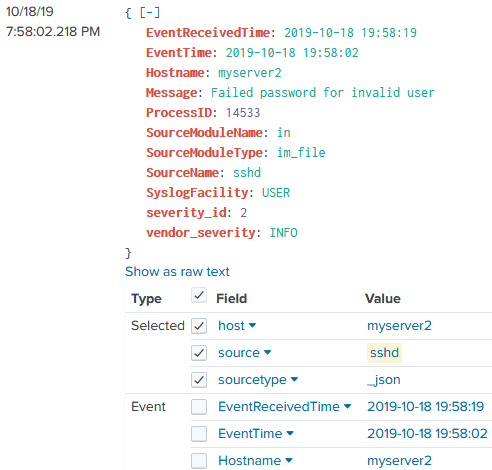
</Output>{
"event": {
"EventReceivedTime": "2019-10-18 19:58:19",
"SourceModuleName": "in",
"SourceModuleType": "im_file",
"SyslogFacility": "USER",
"vendor_severity": "INFO",
"severity_id": 2,
"EventTime": "2019-10-18 19:58:02",
"Hostname": "myserver2",
"ProcessID": 14533,
"SourceName": "sshd",
"Message": "Failed password for invalid user"
},
"time": "1571428682.218749",
"sourcetype": "_json",
"host": "myserver2",
"source": "sshd"
}
Send and receive logs to and from the Splunk Universal Forwarder
The Splunk Universal Forwarder sends data in a so-called cooked format using the Splunk-to-Splunk (S2S) protocol. However, the cooked format can be turned off for communication with third-party solutions.
You must configure the Splunk indexer to receive data from Splunk Universal Forwarder. See Deploy the Universal Forwarder in the Splunk documentation for more information.
For example, execute the following command to configure a Splunk Universal Forwarder to send data to an indexer on port 9997:
$ sudo splunk add forward-server 192.168.1.71:9997The following NXLog Agent configuration reads syslog messages from /var/log/messages and forwards them to a Splunk Universal Forwarder instance in JSON format.
<Extension syslog>
    Module    xm_syslog
</Extension>

<Extension json>
    Module    xm_json
</Extension>

<Input var_log_messages>
    Module    im_file
    File      '/var/log/messages'
    Exec      parse_syslog();
</Input>

<Output splunk_universal_forwarder>
    Module    om_tcp
    Host      192.168.1.81:1538
    <Exec>
        $Forwarder = TRUE;
        to_json();
    </Exec>
</Output>First, configure the Splunk Universal Forwarder to send logs to NXLog Agent by opening the configuration file at $SPLUNK_HOME/etc/system/local/outputs.conf and adding the following settings.
Replace <nxlog-server> with NXLog Agent IP or hostname.
[indexAndForward]
index = false

[tcpout]
defaultGroup = default-autolb-group

[tcpout:default-autolb-group]
disabled = false
server = <nxlog-server>:9997

[tcpout-server://<nxlog-server>:9997]
sendCookedData = false
Then configure NXLog Agent to receive logs from the Splunk Universal Forwarder. The following configuration uses the im_tcp input module to listen for connections on all available interfaces.
<Input tcp_listen>
    Module        im_tcp
    ListenAddr    0.0.0.0:9997
    InputType     Dgram (1)
</Input>| 1 | Setting the InputType common module directive to Dgram ensure each packet is treated as an event. |