
Microsoft Routing and Remote Access Service (RRAS)
The Remote Access Server Role in Windows server operating systems provides services for remote user support via VPN or DirectAccess, routing, and publishing of HTTP(S)-based applications outside the corporate network. These services provide logging that can be used to monitor network activity, as well as debug logging that can aid in troubleshooting connectivity issues. This guide demonstrates how NXLog Agent can collect and parse logs that Remote Access services generate.
Routing and Remote Access Service logs
When RRAS is configured to provide VPN or routing services, various options are available for logging connection attempts (both successful and unsuccessful), errors, warnings, and additional debug logging that individual RRAS components generate.
Configuring RRAS logging
Follow these steps to configure logging for VPN connections and routing services:
-
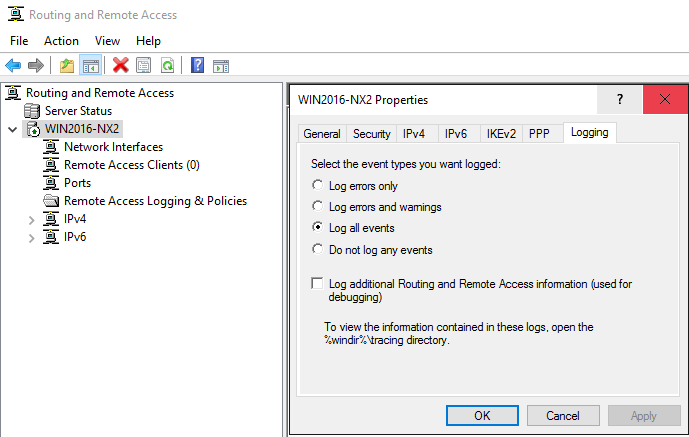
Open Server Manager and go to Tools > Routing and Remote Access.
-
From the left pane, right-click on the server name and select Properties.
-
Click on the Logging tab.
-
Select the event types you want to log.
-
To switch on debug logging, check the Log additional Routing and Remote Access information option. This is only suggested for troubleshooting and should be switched off once it is no longer required.
-
Click OK to close the Properties dialog.
Tracing can also be activated using the netsh command-line tool.
Use this method to activate tracing for specific components only.
For example, the following command activates tracing for the rasman component:
> netsh ras set tracing rasman enabledThe * wildcard can be used to activate tracing for all components:
> netsh ras set tracing * enabledTo deactivate tracing:
> netsh ras set tracing * disabled
For Windows Server 2008 R2 and older, you may need to configure tracing using the netsh tool in addition to the UI configuration.
|
Collecting RRAS events from Windows Event Log
Routing and Remote Access logs events to the System log in Windows Event Log. The type of events that will be logged depends on the logging level chosen when Configuring RRAS logging.
This configuration uses the im_msvistalog input module to
collect system events from Windows Event Log.
It specifies the QueryXML directive to filter for events with source RemoteAccess.
The log record is then converted to JSON using the to_json() procedure from the xm_json module.
<Extension json>
    Module    xm_json
</Extension>

<Input rras_events>
    Module    im_msvistalog
    <QueryXML>
        <QueryList>
            <Query Id="0" Path="System">
                <Select Path="System">*[System[Provider[
                    @Name='RemoteAccess']]]</Select>
            </Query>
        </QueryList>
    </QueryXML>
    Exec      to_json();
</Input>{
"EventTime": "2021-10-19T10:37:37.639581+02:00",
"Hostname": "WIN2016-NX2.nx.local",
"Keywords": "36028797018963968",
"EventType": "INFO",
"SeverityValue": 2,
"Severity": "INFO",
"EventID": 20274,
"SourceName": "RemoteAccess",
"TaskValue": 0,
"RecordNumber": 7271,
"ExecutionProcessID": 0,
"ExecutionThreadID": 0,
"Channel": "System",
"Message": "RoutingDomainID- {00000000-0000-0000-0000-000000000000}: CoID={NA}: The user NX\\jdoe connected on port VPN4-127 has been assigned address 192.168.0.123",
"Opcode": "Info",
"Data": "{00000000-0000-0000-0000-000000000000}",
"Data_1": "{NA}",
"Data_2": "NX\\jdoe",
"Data_3": "VPN4-127",
"Data_4": "10.0.0.201",
"EventReceivedTime": "2021-10-19T10:37:37.811903+02:00",
"SourceModuleName": "rras_events",
"SourceModuleType": "im_msvistalog"
}Collecting RRAS debug logging
When the Log additional Routing and Remote Access information option is selected in the RRAS logging configuration, additional logging is created that can help troubleshoot connection failures. This includes ETW logs and tracing information for RRAS components, the latter being written to a file.
The Microsoft-Windows-RRAS provider generates RRAS trace logs.
The NXLog Agent configuration below uses the im_etw input module to collect events from this provider.
The log record is then converted to JSON using the to_json() procedure from the xm_json module.
<Extension json>
    Module    xm_json
</Extension>

<Input rras_etw>
    Module      im_etw
    Provider    Microsoft-Windows-RRAS
    Exec        to_json();
</Input>{
"SourceName": "Microsoft-Windows-RRAS",
"ProviderGuid": "{24989972-0967-4E21-A926-93854033638E}",
"Channel": "Notification Channel ",
"Opcode": "Info ",
"EventID": 18001,
"Version": 0,
"ChannelID": 16,
"OpcodeValue": 0,
"TaskValue": 0,
"Keywords": "9223372036854776320",
"EventTime": "2021-10-19T10:37:37.228855+02:00",
"ExecutionProcessID": 756,
"ExecutionThreadID": 3276,
"EventType": "INFO",
"SeverityValue": 2,
"Severity": "INFO",
"Hostname": "WIN2016-NX2",
"Domain": "NT AUTHORITY",
"AccountName": "SYSTEM",
"UserID": "S-1-5-21-3309588957-2002815810-1100576919-1103",
"AccountType": "User",
"Flags": "EXTENDED_INFO|IS_64_BIT_HEADER|PROCESSOR_INDEX (577)",
"DebugString": "DDMRoutingDomainLookupForIncomingConnection: Mapping the User jdoe@nx.local, Domain: NX to default routing domain",
"EventReceivedTime": "2021-10-19T10:23:38.173484+02:00",
"SourceModuleName": "rras_etw",
"SourceModuleType": "im_etw"
}By default, component trace logs are written to the %windir%\tracing directory.
This path can be changed from the Registry Editor (regedit) by navigating to HKEY_LOCAL_MACHINE\SOFTWARE\Microsoft\Tracing and modifying the FileDirectory value for the relevant components.
The configuration below uses the im_file input module to read all trace logs from the default location.
Since trace logs can contain timestamps with or without a date, it uses two regular expressions to parse log lines into structured data.
The first regular expression handles timestamps in the format MM-DD hh:mm:ss:s while the second one handles timestamps in the format hh:mm:ss.
If neither of these regular expressions match, the entire log line is copied to the $Message field.
Finally, logs records are converted to JSON using the to_json() procedure of the xm_json module, which also enriches the log record with the NXLog Agent core fields.
<Extension json>
    Module    xm_json
</Extension>

<Input rras_trace>
    Module    im_file
    File      'C:\Windows\tracing\*.LOG'
    <Exec>
        # Match log lines with timestamp format MM-DD hh:mm:ss:s
        if $raw_event =~ /^\[(?<ThreadID>\d+)\] (?<EventTime>\d\d-\d\d \d\d:\d\d:\d\d:\d+): (?<Message>.+)$/
        {
             # Add current year to the timestamp
             $EventTime = year(now()) + "-" + $EventTime;
        }
        # Match log lines with timestamp format hh:mm:ss
        else if $raw_event =~ /^\[(?<ThreadID>\d+)\] (?<EventTime>\d\d:\d\d:\d\d): (?<Messge>.+)$/
        {
             # Add current date to the timestamp
             $today = now();
             $EventTime = year($today) + "-" + month($today) + "-" \
                + day($today) + " " + $EventTime;
        }
        else
        {
             $Message = $raw_event;
        }

        $Component = file_name();
        if $Component =~ /^.+\\(.+).LOG$/i
        {
             $Component = $1;
        }
        to_json();
    </Exec>
</Input>The following sample was collected from RASMAN.LOG, the trace log file
for the RASMAN component.
[2924] 10-19 10:37:37:475: onecoreuap\net\rras\ras\rasman\rasman\request.c, 8824: Activated Route , port = VPN4-127(0xd0f12a20), bundlehandle 0x5, prottype = 2048, dwErr = 0{
"EventReceivedTime": "2021-10-19T10:37:58.908321+02:00",
"SourceModuleName": "rras_trace",
"SourceModuleType": "im_file",
"EventTime": "2021-10-19 10:37:37:475",
"Message": "onecoreuap\\net\\rras\\ras\\rasman\\rasman\\request.c, 8824: Activated Route , port = VPN4-127(0xd0f12a20), bundlehandle 0x5, prottype = 2048, dwErr = 0",
"ThreadID": "2924",
"Component": "RASMAN"
}Network Policy Server logs
NPS allows you to create network access policies to define who is authorized to connect to the network via VPN and any constraints that should be applied. NPS logging, also known as NPS accounting, can be configured to log connection requests to a log file and/or to a SQL Server database.
Configuring NPS logging
Follow these steps to configure NPS logging on a server with the Routing and Remote Access role installed.
-
Open Server Manager and go to Tools > Routing and Remote Access.
-
From the left pane, expand the server name, right-click on Remote Access Logging & Policies, and select Launch NPS.
-
In the Network Policy Server console, click on Accounting.
-
From the right pane, click on Configure Accounting.
-
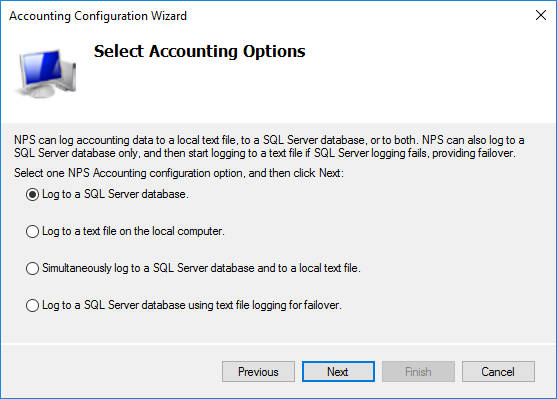
The Accounting Configuration Wizard is displayed. Click Next.
-
Select whether to log to a SQL Server database, text file, or both. Click Next.
-
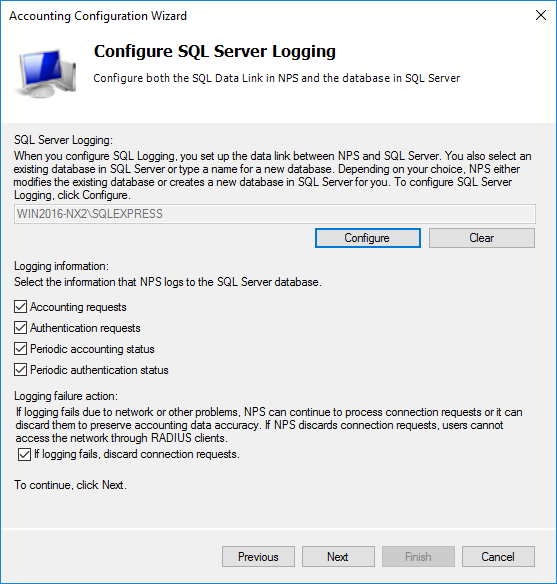
Depending on the option selected in the previous step, configure SQL Server settings or specify the log file directory.
-
Choose the information that should be logged and the action to be taken in the event of a logging failure.
-
Click Next.
-
Review the settings and click Next.
-
Once the configuration is complete, click Close to close the wizard.
For more information about configuration options, see Microsoft’s documentation on how to Configure Network Policy Server Accounting.
Collecting NPS logs from a file
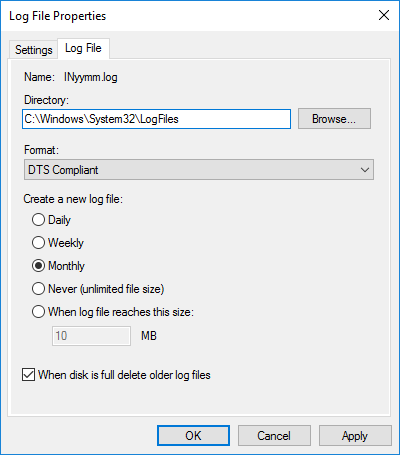
By default, NPS accounting creates logging in the %SYSTEMROOT%\System32\LogFiles directory. The filename is in the format INYYMM.log, where YY is the year and MM is the month when the log file is created. The logs can be written in DTS Compliant format, or the legacy ODBC or IAS formats. To view or change the log format:
-
Open Server Manager and go to Tools > Network Policy Server.
-
From the left pane, select Accounting.
-
Under Log File Properties, select Change Log File Properties.
-
Click on the Log File tab.
-
The Format drop-down shows the currently configured format.
-
Change the selected format and click the OK button to update the settings.
The examples below demonstrate how NXLog Agent can process NPS logs in the DTS Compliant and ODBC (legacy) formats. See Microsoft’s documentation on how to Interpret NPS Database Format Log Files and Entries recorded in DTS Compliant log files for more information.
The configuration below uses the im_file input module to collect logs from all NPS accounting log files found in the default location.
The xm_xml module is used to parse log records into structured data.
Fields that have the XML data_type attribute set to 0 are converted to integer type using the integer() function.
The log record is then converted to JSON using the to_json() procedure from the xm_json module.
<Extension json>
    Module    xm_json
</Extension>

<Extension xml>
    Module    xm_xml
</Extension>

<Input nps_accounting>
    Module    im_file
    File      'C:\Windows\System32\LogFiles\IN*.log'
    <Exec>
        parse_xml();

        # Convert integer type fields
        if (${Framed-MTU})
           ${Framed-MTU} = integer(${Framed-MTU});
        if (${Service-Type})
           ${Service-Type} = integer(${Service-Type});
        if (${Framed-Protocol})
            ${Framed-Protocol} = integer(${Framed-Protocol});
        if (${NAS-Port})
           ${NAS-Port} = integer(${NAS-Port});
        if (${NAS-Port-Type})
            ${NAS-Port-Type} = integer(${NAS-Port-Type});
        if (${Tunnel-Type})
            ${Tunnel-Type} = integer(${Tunnel-Type});
        if (${Tunnel-Medium-Type})
            ${Tunnel-Medium-Type} = integer(${Tunnel-Medium-Type});
        if (${MS-Network-Access-Server-Type})
            ${MS-Network-Access-Server-Type} = integer(
              ${MS-Network-Access-Server-Type}
            );
        if (${MS-RAS-Vendor})
            ${MS-RAS-Vendor} = integer(${MS-RAS-Vendor});
        if (${Provider-Type})
            ${Provider-Type} = integer(${Provider-Type});
        if (${Authentication-Type})
            ${Authentication-Type} = integer(${Authentication-Type});
        if (${Packet-Type})
            ${Packet-Type} = integer(${Packet-Type});
        if (${Reason-Code})
            ${Reason-Code} = integer(${Reason-Code});

        to_json();
    </Exec>
</Input>The following sample was collected from an NPS accounting log file and shows a VPN connection request.
<Event><Timestamp data_type="4">19/10/2021 08:34:34.534</Timestamp><Computer-Name data_type="1">WIN2016-NX2</Computer-Name><Event-Source data_type="1">RAS</Event-Source><Framed-MTU data_type="0">1400</Framed-MTU><Acct-Session-Id data_type="1">2</Acct-Session-Id><NAS-Identifier data_type="1">WIN2016-NX2</NAS-Identifier><NAS-IP-Address data_type="3">10.0.0.106</NAS-IP-Address><Service-Type data_type="0">2</Service-Type><Framed-Protocol data_type="0">1</Framed-Protocol><NAS-Port data_type="0">129</NAS-Port><NAS-Port-Type data_type="0">5</NAS-Port-Type><Tunnel-Type data_type="0">1</Tunnel-Type><Tunnel-Medium-Type data_type="0">1</Tunnel-Medium-Type><Called-Station-Id data_type="1">192.168.56.101</Called-Station-Id><Tunnel-Server-Endpt data_type="1">192.168.56.101</Tunnel-Server-Endpt><Calling-Station-Id data_type="1">192.168.56.105</Calling-Station-Id><Tunnel-Client-Endpt data_type="1">192.168.56.105</Tunnel-Client-Endpt><User-Name data_type="1">jdoe</User-Name><Client-IP-Address data_type="3">10.0.0.106</Client-IP-Address><Client-Friendly-Name data_type="1">WIN2016-NX2</Client-Friendly-Name><MS-Network-Access-Server-Type data_type="0">2</MS-Network-Access-Server-Type><MS-RAS-Vendor data_type="0">311</MS-RAS-Vendor><MS-RAS-Version data_type="1">MSRASV5.20</MS-RAS-Version><MS-RAS-Client-Version data_type="1">MSRASV5.20</MS-RAS-Client-Version><MS-RAS-Client-Name data_type="1">MSRAS-0-WIN10-NX3</MS-RAS-Client-Name><MS-RAS-Correlation-ID data_type="1">{0ED13CF1-C7E0-0000-925C-D10EE0C7D701}</MS-RAS-Correlation-ID><Proxy-Policy-Name data_type="1">Microsoft Routing and Remote Access Service Policy</Proxy-Policy-Name><Provider-Type data_type="0">1</Provider-Type><SAM-Account-Name data_type="1">NX\jdoe</SAM-Account-Name><Class data_type="1">311 1 fe80::ed1f:28e3:772:8ead 19/10/2021 06:09:51 1</Class><Authentication-Type data_type="0">5</Authentication-Type><NP-Policy-Name data_type="1">Admin VPN Policy</NP-Policy-Name><Fully-Qualifed-User-Name data_type="1">nx.local/Users/John Doe</Fully-Qualifed-User-Name><Packet-Type data_type="0">1</Packet-Type><Reason-Code data_type="0">0</Reason-Code></Event>{
"EventReceivedTime": "2021-10-19T08:50:31.814427+02:00",
"SourceModuleName": "rras_nps",
"SourceModuleType": "im_file",
"Timestamp": "19/10/2021 08:34:34.534",
"Computer-Name": "WIN2016-NX2",
"Event-Source": "RAS",
"Framed-MTU": 1400,
"Acct-Session-Id": "2",
"NAS-Identifier": "WIN2016-NX2",
"NAS-IP-Address": "10.0.0.106",
"Service-Type": 2,
"Framed-Protocol": 1,
"NAS-Port": 129,
"NAS-Port-Type": 5,
"Tunnel-Type": 1,
"Tunnel-Medium-Type": 1,
"Called-Station-Id": "192.168.56.101",
"Tunnel-Server-Endpt": "192.168.56.101",
"Calling-Station-Id": "192.168.56.105",
"Tunnel-Client-Endpt": "192.168.56.105",
"User-Name": "jdoe",
"Client-IP-Address": "10.0.0.106",
"Client-Friendly-Name": "WIN2016-NX2",
"MS-Network-Access-Server-Type": 2,
"MS-RAS-Vendor": 311,
"MS-RAS-Version": "MSRASV5.20",
"MS-RAS-Client-Version": "MSRASV5.20",
"MS-RAS-Client-Name": "MSRAS-0-WIN10-NX3",
"MS-RAS-Correlation-ID": "{0ED13CF1-C7E0-0000-925C-D10EE0C7D701}",
"Proxy-Policy-Name": "Microsoft Routing and Remote Access Service Policy",
"Provider-Type": 1,
"SAM-Account-Name": "NX\\jdoe",
"Class": "311 1 fe80::ed1f:28e3:772:8ead 19/10/2021 06:09:51 1",
"Authentication-Type": 5,
"NP-Policy-Name": "Admin VPN Policy",
"Fully-Qualifed-User-Name": "nx.local/Users/John Doe",
"Packet-Type": 1,
"Reason-Code": 0
}The configuration below uses the im_file input module to collect logs from all NPS accounting log files found in the default location. Log records are parsed into structured data using the parse_nps() procedure of the xm_nps module. The log record is then converted to JSON using the to_json() procedure from the xm_json module.
<Extension json>
    Module    xm_json
</Extension>

<Extension nps>
    Module    xm_nps
</Extension>

<Input nps_accounting>
    Module    im_file
    File      'C:\Windows\System32\LogFiles\IN*.log'
    <Exec>
        parse_nps();
        to_json();
    </Exec>
</Input>The following sample was collected from an NPS accounting log file and shows a successful VPN connection.
"WIN2016-NX2","RAS",19/10/2021,10:37:37,1,"jdoe@nx.local","nx.local/Users/John Doe","10.0.0.101","10.0.0.104",,,"WIN2016-NX2","192.168.0.120",129,,"192.168.0.120","WIN2016-NX2",,,5,,1,2,5,"Admin VPN Policy",0,"311 1 fe80::ed1f:28e3:772:8ead 19/10/2021 08:30:13 5",,,,,,,,,"6",,,,,,,,,1,1,"10.0.0.104","10.0.0.101",,,,,,,"MSRASV5.20",311,,,,,"Microsoft Routing and Remote Access Service Policy",1,,,"MSRAS-0-WIN10-NX3","MSRASV5.20"{
"EventReceivedTime": "2021-10-19T10:37:38.299694+02:00",
"SourceModuleName": "nps_accounting",
"SourceModuleType": "im_file",
"Hostname": "WIN2016-NX2",
"ServiceName": "RAS",
"RecordDate": "19/10/2021",
"RecordTime": "10:37:37",
"PacketType": "Access-Request",
"AccountName": "jdoe@nx.local",
"FullyQualifiedDistinguishedName": "nx.local/Users/John Doe",
"CalledStationID": "10.0.0.101",
"CallingStationID": "10.0.0.104",
"NASIdentifier": "WIN2016-NX2",
"NASIPAddress": "192.168.0.120",
"NASPort": 129,
"ClientIPAddress": "192.168.0.120",
"ClientFriendlyName": "WIN2016-NX2",
"NASPortType": 5,
"FramedProtocol": 1,
"ServiceType": 2,
"AuthenticationType": "EAP",
"PolicyName": "Admin VPN Policy",
"ReasonCode": "IAS_SUCCESS",
"Class": "311 1 fe80::ed1f:28e3:772:8ead 19/10/2021 08:30:13 5",
"AcctSessionId": "6",
"TunnelType": 1,
"TunnelMediumType": 1,
"TunnelClientEndpt": "10.0.0.104",
"TunnelServerEndpt": "10.0.0.101",
"MSRASVersion": "MSRASV5.20",
"MSRASVendor": 311,
"ProxyPolicyName": "Microsoft Routing and Remote Access Service Policy",
"ProviderType": 1,
"MSRASClientName": "MSRAS-0-WIN10-NX3",
"MSRAS-ClientVersion": "MSRASV5.20"
}Collecting NPS logs from SQL Server
NXLog Agent can collect NPS accounting logs from SQL Server using the im_odbc input module. This module requires an ODBC driver to be installed on the server. See our Microsoft SQL Server integration guide for instructions on configuring ODBC.
This configuration collects NPS log records from the accounting_data table.
im_odbc requires the ConnectionString directive to be specified and an SQL SELECT statement that specifies how to query the data.
The statement must return an incremental id field and contain a WHERE clause specifying the same field to filter the result.
Since the accounting_data table already contains a numeric id field, the SQL statement can simply collect all fields.
The log record is then converted to JSON using the to_json() procedure from the xm_json module.
<Extension json>
    Module              xm_json
</Extension>

<Input nps_db>
    Module              im_odbc
    ConnectionString    Driver={ODBC Driver 17 for SQL Server}; \
                        Server=<computer name>\<instance name>; \
                        Trusted_Connection=yes; Database=<database name>
    SQL                 SELECT * FROM <database name>.dbo.accounting_data \
                        WHERE id > ?
    Exec                to_json();
</Input>{
"id": 5,
"timestamp": "2021-10-19T17:57:50.813000+02:00",
"Computer_Name": "WIN2016-NX2",
"Packet_Type": 1,
"User_Name": "jdoe",
"Client_IP_Address": "192.168.0.123",
"Fully_Qualified_Machine_Name": null,
"NP_Policy_Name": "Admin VPN Policy",
"MS_Quarantine_State": null,
"MS_Extended_Quarantine_State": null,
"System_Health_Result": null,
"System_Health_ResultEx": null,
"MS_Network_Access_Server_Type": 2,
"Called_Station_Id": "10.0.0.101",
"MS_Quarantine_Grace_Time": null,
"MS_Quarantine_User_Class": null,
"Client_IPv6_Address": null,
"Not_Quarantine_Capable": null,
"AFW_Zone": null,
"AFW_Protection_Level": null,
"Quarantine_Update_Non_Compliant": null,
"MS_Machine_Name": null,
"OS_Version": null,
"MS_Quarantine_Session_Id": null,
"EventReceivedTime": "2021-10-19T17:58:19.045597+02:00",
"SourceModuleName": "nps_db",
"SourceModuleType": "im_odbc"
}DirectAccess logs
When DirectAccess is used, activity logs can be found in the following operational event logs:
-
Microsoft-Windows-Base-Filtering-Engine-Connections
-
Microsoft-Windows-Base-Filtering-Engine-Resource-Flows
-
Microsoft-Windows-Iphlpsvc
-
Microsoft-Windows-WinNat
Events from these logs can be correlated to track a connection, the user that initiated it, and the resources that they accessed. See the Microsoft blog post on Additional ways to monitor DirectAccess machine/user activity for in-depth information on analyzing these event logs.
In addition to events provided by these logs, audit events from the Security log can reveal authentication failures and attempts to access objects. See our Windows Security audit guide for more information.
The configuration below uses the im_msvistalog input module to collect events from the relevant providers. The log record is then converted to JSON using the to_json() procedure from the xm_json module.
<Extension json>
    Module    xm_json
</Extension>

<Input directaccess_events>
    Module    im_msvistalog
    <QueryXML>
      <QueryList>
        <Query Id="0">
          <Select Path=
          "Microsoft-Windows-Base-Filtering-Engine-Connections/Operational">*
          </Select>
        </Query>
        <Query Id="1">
          <Select Path=
          "Microsoft-Windows-Base-Filtering-Engine-Resource-Flows/Operational">*
          </Select>
        </Query>
        <Query Id="2">
          <Select Path="Microsoft-Windows-Iphlpsvc/Operational">*</Select>
        </Query>
        <Query Id="3">
          <Select Path="Microsoft-Windows-WinNat/Oper">*</Select>
        </Query>
       </QueryList>
    </QueryXML>
    Exec      to_json();
</Input>{
"EventTime": "2021-10-22T11:32:16.175972+01:00",
"Hostname": "WIN2016-NX4.nx.local",
"Keywords": "9223372036854775808",
"EventType": "INFO",
"SeverityValue": 2,
"Severity": "INFO",
"EventID": 2000,
"SourceName": "Microsoft-Windows-Base-Filtering-Engine-Connections",
"ProviderGuid": "{121D3DA8-BAF1-4DCB-929F-2D4C9A47F7AB}",
"Version": 0,
"TaskValue": 0,
"OpcodeValue": 0,
"RecordNumber": 1,
"ExecutionProcessID": 908,
"ExecutionThreadID": 4832,
"Channel": "Microsoft-Windows-Base-Filtering-Engine-Connections/Operational",
"Domain": "NT AUTHORITY",
"AccountName": "LOCAL SERVICE",
"UserID": "S-1-5-19",
"AccountType": "Well Known Group",
"Message": "New Connection",
"Opcode": "Info",
"ConnectionId": "13279290616175295901",
"MachineAuthenticationMethod": "2",
"RemoteMachineAccount": "NX\\WIN10-NX3$",
"UserAuthenticationMethod": "2",
"RemoteUserAcount": "NX\\WIN10-NX3$",
"RemoteIPAddress": "2002:4d4d:65:1000:1caa:cab9:5bd4:9ad0",
"LocalIPAddress": "2002:4d4d:65::4d4d:65",
"TechnologyProviderKey": "{1BEBC969-61A5-4732-A177-847A0817862A}",
"IPsecTrafficMode": "1",
"DHGroup": "0",
"StartTime": "2021-10-21T11:50:16.175Z",
"EventReceivedTime": "2021-10-22T11:32:49.203776+01:00",
"SourceModuleName": "directaccess_events",
"SourceModuleType": "im_msvistalog"
}Remote Access statistics
The health of RRAS can be monitored with PowerShell. See the Microsoft documentation for a complete list of Remote Access cmdlets. NXLog Agent can be configured to execute a PowerShell script and collect Remote Access statistics at intervals. The statistics can then be written to a log file or forwarded to a server health monitoring service.
The following script is an example of how you can use the Get-RemoteAccessConnectionStatisticsSummary and Get-RemoteAccessConnectionStatistics cmdlets to collect real-time statistics of DirectAccess and VPN connections. The script processes the results returned by these two cmdlets and writes data to the standard output in JSON format.
param (
    [int]$Interval = 10
)

Try {
    while($true) {
        $ConnectionSummary = Get-RemoteAccessConnectionStatisticsSummary

        foreach ($itm in $ConnectionSummary.CimInstanceProperties) {
            if ([string]::IsNullOrWhiteSpace($itm.Value)) {
                $itm.Value = 0
            }
        }

        $ActiveConnections = @()

        foreach ($connection in Get-RemoteAccessConnectionStatistics) {
            $ActiveConnections += @{
                    ClientIPAddress = $connection.ClientIPv4Address.IPAddressToString
                    HostName = $connection.HostName
                    UserName = $connection.UserName[0]
                    ConnectionState = $connection.UserActivityState
                    ConnectionDuration = $connection.ConnectionDuration
                    ConnectionType = $connection.ConnectionType
                    AuthenticationMethod = $connection.AuthMethod
                    ConnectionStartTime = $connection.ConnectionStartTime.DateTime
                    TotalBytesIn = $connection.TotalBytesIn
                    TotalBytesOut = $connection.TotalBytesOut
            }
        }

        $event = @{
            TotalConnections = $ConnectionSummary.TotalConnections
            TotalDAConnections = $ConnectionSummary.TotalDAConnections
            TotalVpnConnections = $ConnectionSummary.TotalVpnConnections
            TotalUniqueUsers = $ConnectionSummary.TotalUniqueUsers
            MaxConcurrentConnection = $ConnectionSummary.MaxConcurrentConnections
            TotalCumulativeConnections = $ConnectionSummary.TotalCumulativeConnections
            TotalBytesIn = $ConnectionSummary.TotalBytesIn
            TotalBytesOut = $ConnectionSummary.TotalBytesOut
            TotalBytesInOut = $ConnectionSummary.TotalBytesInOut
            ActiveConnections = $conns
        }

        Write-Output $event | ConvertTo-JSON -Compress
        Start-Sleep -s $Interval
    }
}
Catch {
    Write-Error "An unhandled exception occurred!"
    exit 1
}
This NXLog Agent configuration uses the im_exec input module to execute the PowerShell script.
Since our script produces logs in JSON format, the configuration parses records with the parse_json() procedure of the xm_json module.
It uses the hostname_fqdn() function to enrich log records with the $ServerName field and then converts the data back to JSON using the to_json() procedure.
This will also add the NXLog Agent core fields, which include the $EventReceivedTime field.
<Extension json>
    Module     xm_json
</Extension>

<Input remote_access_stats>
    Module     im_exec
    Command    C:\Windows\System32\WindowsPowerShell\v1.0\powershell.exe
    Arg        C:\Scripts\ra-connection-summary.ps1
    Arg        -Interval
    Arg        60
    <Exec>
        parse_json();
        $ServerName = hostname_fqdn();
        to_json();
    </Exec>
</Input>| The user running NXLog Agent needs to have permission to execute the script. |
{
  "EventReceivedTime": "2021-10-26T12:17:30.059723+02:00",
  "SourceModuleName": "rras_stats",
  "SourceModuleType": "im_exec",
  "TotalConnections": 1,
  "ActiveConnections": [
    {
      "ConnectionDuration": 9780,
      "ClientIPAddress": "10.0.0.151",
      "UserName": "NX\\jdoe",
      "ConnectionState": "Active",
      "HostName": "-",
      "TotalBytesOut": 16534797,
      "AuthenticationMethod": "Eap MSChapv2",
      "ConnectionStartTime": "Tuesday, October 26, 2021 9:34:29 AM",
      "ConnectionType": "Vpn",
      "TotalBytesIn": 961870
    }
  ],
  "TotalBytesInOut": 17496667,
  "TotalVpnConnections": 1,
  "MaxConcurrentConnection": 1,
  "TotalCumulativeConnections": 1,
  "TotalUniqueUsers": 0,
  "TotalBytesOut": 16534797,
  "TotalDAConnections": 0,
  "TotalBytesIn": 961870,
  "ServerName": "WIN2016-NX2.nx.local"
}
Web Application Proxy logs
The Web Application Proxy service logs events to the Microsoft-Windows-WebApplicationProxy admin event log.
These events contain information related to configuration changes, connectivity, authentication, tokens, and cookies.
See the Microsoft documentation for a list of some of the Administrator Console Events that can help with troubleshooting.
The configuration below uses the im_msvistalog input module to collect events from the Microsoft-Windows-WebApplicationProxy provider.
The log record is then converted to JSON using the to_json() procedure from the xm_json module.
<Extension json>
    Module    xm_json
</Extension>

<Input wap_events>
    Module    im_msvistalog
    <QueryXML>
        <QueryList>
            <Query Id="0" Path="Microsoft-Windows-WebApplicationProxy/Admin">
                <Select Path=
                "Microsoft-Windows-WebApplicationProxy/Admin">*
                </Select>
            </Query>
        </QueryList>
    </QueryXML>
    Exec      to_json();
</Input>{
"EventTime": "2021-11-01T17:02:57.013910+01:00",
"Hostname": "WIN2016-NX2.nx.local",
"Keywords": "9223372036854775808",
"LevelValue": 4,
"EventType": "INFO",
"SeverityValue": 2,
"Severity": "INFO",
"EventID": 14021,
"SourceName": "Microsoft-Windows-WebApplicationProxy",
"ProviderGuid": "{EA19457D-AFB4-4B25-B526-DA576CCE3FE4}",
"Version": 0,
"TaskValue": 0,
"OpcodeValue": 0,
"RecordNumber": 19,
"ExecutionProcessID": 5720,
"ExecutionThreadID": 180,
"Channel": "Microsoft-Windows-WebApplicationProxy/Admin",
"Domain": "NT AUTHORITY",
"AccountName": "SYSTEM",
"UserID": "S-1-5-18",
"AccountType": "User",
"Message": "The reservation for the following URL was created successfully: http://testapp.nx.local/.",
"Opcode": "Info",
"Level": "Information",
"Url": "http://testapp.nx.local/",
"EventReceivedTime": "2021-11-01T17:02:58.702845+01:00",
"SourceModuleName": "wap_events",
"SourceModuleType": "im_msvistalog"
}