
Microsoft SharePoint
Microsoft SharePoint Server provides many different types of logs, many of which are configurable. SharePoint logs are written to files, databases, and Windows Event Log. NXLog Agent can be configured to collect SharePoint logs, as discussed in the following sections.
See Monitoring and Reporting in SharePoint Server on Microsoft TechNet for more information about SharePoint logging.
SharePoint Diagnostic Logs
SharePoint diagnostic logs are handled by the Unified Logging Service (ULS), the primary logging mechanism in SharePoint. The ULS writes SharePoint logs to Windows Event Log and trace log files. The event log and trace log levels of each category or subcategory can be adjusted individually.
The trace log files are generated by and stored locally on each server running
SharePoint in the farm, using file names containing the server hostname and
timestamp (HOSTNAME-YYYYMMDD-HHMM.log). SharePoint trace logs are created at
regular intervals and whenever there is an IISRESET. It is common for many trace
logs to be generated within 24 hours.
If configured in the farm settings, each SharePoint server also writes trace logs to the logging database. These logs are written by the Diagnostic Data Provider: Trace Log job. NXLog Agent can be configured to collect these SharePoint logs from the logging database.
For more information about diagnostic logging, see the Configure diagnostic logging in SharePoint Server article on Microsoft TechNet.
ULS log format
The Unified Logging Service (ULS) trace log files are tab-delimited.
Timestamp              	Process                                 	TID   	Area                          	Category                      	EventID	Level     	Message 	Correlation
10/12/2017 16:02:18.30 	hostcontrollerservice.exe (0x0948)      	0x191C	SharePoint Foundation         	Topology                      	aup1c	Medium  	Current app domain: hostcontrollerservice.exe (1)
10/12/2017 16:02:18.30 	OWSTIMER.EXE (0x11B8)                   	0x1AB4	SharePoint Foundation         	Config DB                     	azcxo	Medium  	SPPersistedObjectCollectionCache: Missed memory and file cache, falling back to SQL query. CollectionType=Children, ObjectType=Microsoft.SharePoint.Administration.SPWebApplication, CollectionParentId=30801f0f-cca6-40bc-9f30-5a4608bbb420, Object Count=1, Stack=   at Microsoft.SharePoint.Administration.SPPersistedObjectCollectionCache.Get[T](SPPersistedObjectCollection`1 collection)     at Microsoft.SharePoint.Administration.SPConfigurationDatabase.Microsoft.SharePoint.Administration.ISPPersistedStoreProvider.GetBackingList[U](SPPersistedObjectCollection`1 persistedCollection)     at Microsoft.SharePoint.Administration.SPPersistedObjectCollection`1.get_BackingList()     at Microsoft.SharePoint.Administration.SPPersistedObjectCollection`1.<GetEnumeratorImpl>d__0.MoveNext()     at Microsoft.Sh...
10/12/2017 16:02:18.30*	OWSTIMER.EXE (0x11B8)                   	0x1AB4	SharePoint Foundation         	Config DB                     	azcxo	Medium  	...arePoint.Utilities.SPServerPerformanceInspector.GetLocalWebApplications()     at Microsoft.SharePoint.Utilities.SPServerPerformanceInspector..ctor()     at Microsoft.SharePoint.Utilities.SPServerPerformanceInspector..cctor()     at Microsoft.SharePoint.Administration.SPTimerStore.InitializeTimer(Int64& cacheVersion, Object& jobDefinitions, Int32& timerMode, Guid& serverId, Boolean& isServerBusy)     at Microsoft.SharePoint.Administration.SPNativeConfigurationProvider.InitializeTimer(Int64& cacheVersion, Object& jobDefinitions, Int32& timerMode, Guid& serverId, Boolean& isServerBusy)
The ULS log file contains the following fields.
-
Timestamp: When the event was logged, in local time
-
Process: Image name of the process logging its activity followed by its process ID (PID) inside parentheses
-
TID: Thread ID
-
Area: Component that produced event (SharePoint Portal Server, SharePoint Server Search, etc.)
-
Category: Detailed category of the event (Topology, Taxonomy, User Profiles, etc.)
-
EventID: Internal Event ID
-
Level: Log level of message (Critical, Unexpected, High, etc.)
-
Message: The message from the application
-
Correlation: Unique GUID-based ID, generated for each request received by the SharePoint server (unique to each request, not each error)
As shown by the second and third events in the log sample above, long messages
span multiple records. In this case, the timestamp of each subsequent record is
followed by an asterisk (*). However, trace log messages are not guaranteed to
appear consecutively within the trace log. See
Writing to the Trace Log
on MSDN.
Configuring diagnostic logging
Adjust the log levels, trace log retention policy, and trace log location as follows.
| The diagnostic logging settings are farm-wide. |
-
Log in to Central Administration and go to Monitoring > Reporting > Configure diagnostic logging.
-
In the Event Throttling section, use the checkboxes to select a set of categories or subcategories for which to modify the logging level. Expand categories as necessary to view the corresponding subcategories.
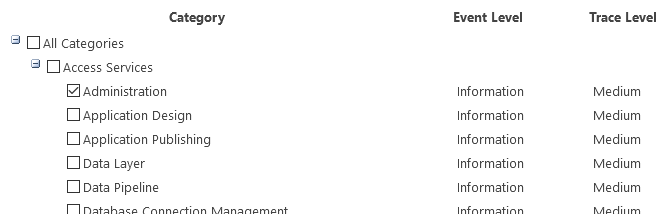
-
Set the event log and trace log levels for the selected categories or subcategories.
Only select the verbose level for troubleshooting, as a large number of logs will be generated. 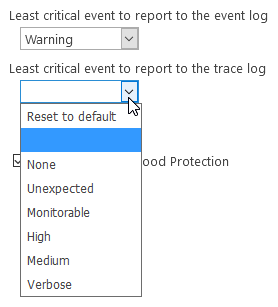
-
To set other levels for other categories or subcategories, click OK and repeat from step 1.
-
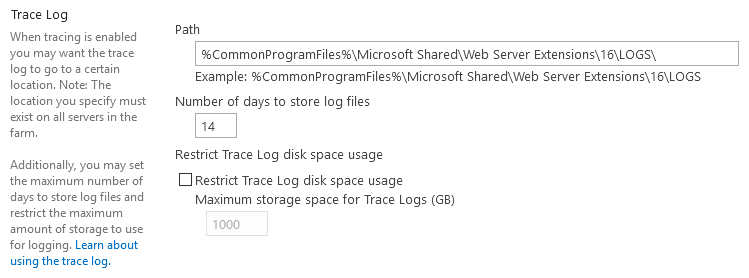
In the Trace Log section, adjust the trace log path and retention policy as required. The specified log location must exist on all servers in the farm.
-
Click OK to apply the settings.
Further steps are required to write trace logs to the logging database. For configuring the logging database itself (server, name, and authentication), see the Configuring usage logging section.
-
Log in to Central Administration and go to Monitoring > Timer Jobs > Review job definitions.
-
Click on the Diagnostic Data Provider: Trace Log job.
-
Click the Enable button to activate the job.
-
Open the Diagnostic Data Provider: Trace Log job again and click Run Now to run the job immediately.
Collecting diagnostic logs
The xm_csv module can be used to parse the tab-delimited trace log files on the local server.
This configuration collects logs from the ULS trace log files and uses
xm_csv to parse them. $EventTime and $Hostname fields are added
to the event record. Each event is converted to JSON format and written to a file.
The defined SHAREPOINT_LOGS path should be set to the trace log file
directory configured in the Configuring diagnostic logging section.
|
define SHAREPOINT_LOGS C:\Program Files\Common Files\microsoft shared\Web Server \
Extensions\16\LOGS

<Extension json>
    Module      xm_json
</Extension>

<Extension uls_parser>
    Module      xm_csv
    Fields      Timestamp, Process, TID, Area, Category, EventID, Level, Message, \
                Correlation
    Delimiter   \t
</Extension>

<Input trace_file>
    Module      im_file
    # Use a file mask to read from ULS trace log files only
    File        '%SHAREPOINT_LOGS%\*-????????-????.log'
    <Exec>
        # Drop header lines and empty lines
        if $raw_event =~ /^(\xEF\xBB\xBF|Timestamp)/ drop();
        else
        {
            # Remove extra spaces
            $raw_event =~ s/ +(?=\t)//g;

            # Parse with uls_parser instance defined above
            uls_parser->parse_csv();

            # Set $EventTime field (second precision only)
            $EventTime = strptime($Timestamp, "%m/%d/%Y %H:%M:%S");

            # Add $Hostname field
            $Hostname = hostname_fqdn();
        }
    </Exec>
</Input>

<Output out>
    Module  om_file
    File    'C:\logs\uls.json'
    Exec    to_json();
</Output>{
"EventReceivedTime": "2017-10-12 16:02:20",
"SourceModuleName": "uls",
"SourceModuleType": "im_file",
"Timestamp": "10/12/2017 16:02:18.30",
"Process": "hostcontrollerservice.exe (0x0948)",
"TID": "0x191C",
"Area": "SharePoint Foundation",
"Category": "Topology",
"EventID": "aup1c",
"Level": "Medium",
"Message": "Current app domain: hostcontrollerservice.exe (1)",
"EventTime": "2017-10-12 16:02:18",
"Hostname": "WIN-SHARE.test.com"
}The im_odbc module can be used to collect diagnostic logs from the farm-wide logging database.
The following Input configuration collects logs from the ULSTraceLog view in the WSS_UsageApplication database.
The
datetime
data type is not timezone-aware, and the timestamps are stored
in UTC. Therefore, an offset is applied when setting the $EventTime
field in the configuration below.
|
<Input trace_db>
    Module              im_odbc
    ConnectionString    Driver={ODBC Driver 13 for SQL Server};\
                        SERVER=SHARESERVE1;DATABASE=WSS_UsageApplication;\
                        Trusted_Connection=yes
    IdType              timestamp

    # With ReadFromLast and MaxIdSQL, NXLog will start reading from the last
    # record when reading from the database for the first time.
    #ReadFromLast        TRUE
    #MaxIdSQL            SELECT MAX(LogTime) AS maxid FROM dbo.ULSTraceLog

    SQL     SELECT LogTime AS id, * FROM dbo.ULSTraceLog \
            WHERE LogTime > CAST(? AS datetime)
    <Exec>
        # Set $EventTime with correct time zone, remove incorrect fields
        $EventTime = parsedate(strftime($id, '%Y-%m-%d %H:%M:%SZ'));
        delete($id);
        delete($LogTime);
    </Exec>
</Input>
See the SharePoint Windows Event Log events section below for an example configuration that reads events from the Windows Event Log.
SharePoint usage and health data logs
SharePoint also collects usage and health data to show how it is used. The
system generates health and administrative reports from these logs. Usage and
health data logs are written as tab-delimited data to various *.usage files in
the configured log location path, and also to the logging database.
FarmId	UserLogin	SiteSubscriptionId	TimestampUtc	CorrelationId	Action	Target	Details
42319181-e881-44f1-b422-d7ab5f8b0117	TEST\Administrator	00000000-0000-0000-0000-000000000000	2017-10-17 23:15:26.667	00000000-0000-0000-0000-000000000000	Administration.Feature.Install	AccSrvRestrictedList	{"Id":"a4d4ee2c-a6cb-4191-ab0a-21bb5bde92fb"}
42319181-e881-44f1-b422-d7ab5f8b0117	TEST\Administrator	00000000-0000-0000-0000-000000000000	2017-10-17 23:15:26.839	00000000-0000-0000-0000-000000000000	Administration.Feature.Install	ExpirationWorkflow	{"Id":"c85e5759-f323-4efb-b548-443d2216efb5"}
For more information, see Overview of monitoring in SharePoint Server on TechNet.
Configuring usage logging
Usage and health data collection can be switched on and configured as follows. For more information about configuring usage and health data logging, see Configure usage and health data collection in SharePoint Server on TechNet.
| The usage and health data collection settings are farm-wide. |
-
Log in to Central Administration and go to Monitoring > Reporting > Configure usage and health data collection.
-
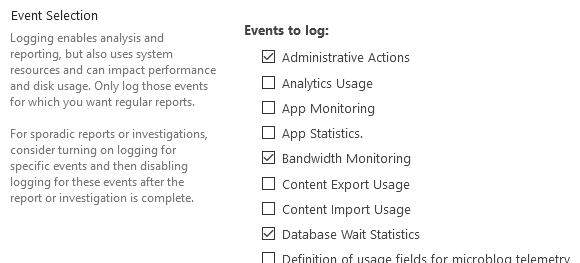
In the Usage Data Collection section, check Enable usage data collection to activate it.
-
In the Event Selection section, use the checkboxes to select the required event categories. We recommend only selecting the categories for which you need regular reports.
-
In the Usage Data Collection Settings section, specify the path for the usage log files. The specified log location must exist on all servers in the farm.
-
In the Health Data Collection section, check Enable health data collection to activate it. Click Health Logging Schedule to edit the job definitions for the Microsoft SharePoint Foundation Timer service.
-
Click the Log Collection Schedule link to edit the job definitions for the Microsoft SharePoint Foundation Usage service.
-
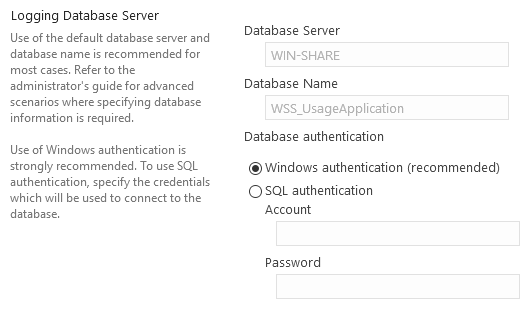
In the Logging Database Server section, adjust the authentication method as required. To change the database server and name, see Log usage data in a different logging database by using Windows PowerShell on TechNet.
-
Click OK to apply the settings.
Collecting usage logs
The xm_csv module can be used to parse the tab-delimited usage and health log files on the local server.
This configuration collects logs from the AdministrativeActions usage log file (see Using Administrative Actions logging in SharePoint Server 2016 on TechNet) and uses xm_csv to parse them.
$EventTime and $Hostname fields are added to the event record. Each event is converted to JSON format and written to a file.
The defined SHAREPOINT_LOGS path should be set to the trace log file
directory configured in the Configuring diagnostic logging section.
|
| Unlike the diagnostic/trace logs, the various usage/health data categories generate logs with differing field sets. Therefore it is not practical to parse multiple types of usage/health logs with a single xm_csv parser. |
define SHAREPOINT_LOGS C:\Program Files\Common Files\microsoft shared\Web Server \
Extensions\16\LOGS

<Extension json>
    Module      xm_json
</Extension>

<Extension admin_actions_parser>
    Module      xm_csv
    Fields      FarmId, UserLogin, SiteSubscriptionId, TimestampUtc, \
                CorrelationId, Action, Target, Details
    Delimiter   \t
</Extension>

<Input admin_actions_file>
    Module      im_file
    # Use a file mask to read from the USAGE files only
    File        '%SHAREPOINT_LOGS%\AdministrativeActions\*.usage'
    <Exec>
        # Drop header lines and empty lines
        if $raw_event =~ /^(\xEF\xBB\xBF|FarmId)/ drop();
        else
        {
            # Parse with parser instance defined above
            admin_actions_parser->parse_csv();

            # Set $EventTime field
            $EventTime = parsedate($TimestampUtc + "Z");

            # Add $Hostname field
            $Hostname = hostname_fqdn();
        }
    </Exec>
</Input>

<Output out>
    Module  om_file
    File    'C:\logs\uls.json'
    Exec    to_json();
</Output>{
"EventReceivedTime": "2017-10-17 20:46:14",
"SourceModuleName": "admin_actions",
"SourceModuleType": "im_file",
"FarmId": "42319181-e881-44f1-b422-d7ab5f8b0117",
"UserLogin": "TEST\\Administrator",
"SiteSubscriptionId": "00000000-0000-0000-0000-000000000000",
"TimestampUtc": "2017-10-17 23:15:26.667",
"CorrelationId": "00000000-0000-0000-0000-000000000000",
"Action": "Administration.Feature.Install",
"Target": "AccSrvRestrictedList",
"Details": {
"Id": "a4d4ee2c-a6cb-4191-ab0a-21bb5bde92fb"
},
"EventTime": "2017-10-17 16:15:26",
"Hostname": "WIN-SHARE.test.com"
}The im_odbc module can be used to collect usage and health logs from the farm-wide logging database.
The following Input configuration collects Administrative Actions logs from the AdministrativeActions view in the WSS_UsageApplication database.
The
datetime
data type is not timezone-aware, and the timestamps are stored
in UTC. Therefore, an offset is applied when setting the $EventTime
field in the configuration below.
|
<Input admin_actions_db>
    Module  im_odbc
    ConnectionString    Driver={ODBC Driver 13 for SQL Server};\
                        SERVER=SHARESERVE1;DATABASE=WSS_UsageApplication;\
                        Trusted_Connection=yes
    IdType              timestamp

    # With ReadFromLast and MaxIdSQL, NXLog will start reading from the last
    # record when reading from the database for the first time.
    #ReadFromLast        TRUE
    #MaxIdSQL            SELECT MAX(LogTime) AS maxid FROM dbo.AdministrativeActions

    SQL     SELECT LogTime AS id, * FROM dbo.AdministrativeActions \
            WHERE LogTime > CAST(? AS datetime)
    <Exec>
        # Set $EventTime with correct time zone, remove incorrect fields
        $EventTime = parsedate(strftime($id, '%Y-%m-%d %H:%M:%SZ'));
        delete($id);
        delete($LogTime);
    </Exec>
</Input>
See the SharePoint Windows Event Log events section for an example configuration that reads events from Windows Event Log.
SharePoint Audit Logs
SharePoint Information Management provides an audit feature that allows tracking
of user actions on a site’s content. SharePoint audit events are stored in the
dbo.AuditData table in the WSS_Content database. The events can be
collected via the SharePoint API or by reading the database directly.
SharePoint audit logging is switched off by default. To switch on audit logging, follow these steps. For more details, see Configure audit data for a site collection on the Microsoft support site.
-
Log in to Central Administration and go to Security > Information policy > Configure Information Management Policy.
-
Verify that the Auditing policy is set to Available.
-
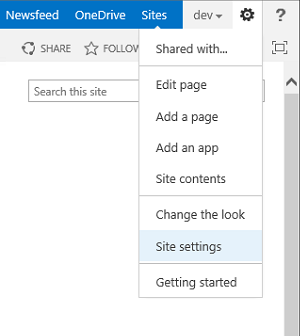
On the site collection home page, click Site actions (gear icon), then Site settings.
-
On the Site Settings page, in the Site Collection Administration section, click Site collection audit settings.
If the Site Collection Administration section is not shown, make sure you have adequate permissions. -
Set audit log trimming settings, select the events to audit, and click OK.
Reading SharePoint audit logs via the API
A PowerShell script can be used to collect audit logs via SharePoint’s API.
For NXLog Agent to have SharePoint Shell access when running as a
service, run the following PowerShell commands. This will add the NT
AUTHORITY\SYSTEM user to the SharePoint_Shell_Access role for the SharePoint
configuration database.
PS> Add-PSSnapin Microsoft.SharePoint.Powershell
PS> Add-SPShellAdmin -UserName "NT AUTHORITY\SYSTEM"This configuration collects audit events via SharePoint’s API with the
auditlog.ps1 PowerShell script. The script also adds the following fields
(performing lookups as required): $ItemName, $Message, $SiteURL, and
$UserName. SharePoint audit logs are collected from all available sites and
the site list is updated each time the logs are collected. See the options in
the script header.
<Extension _json>
    Module  xm_json
</Extension>

envvar systemroot
<Input audit_powershell>
    Module  im_exec
    Command "%systemroot%\System32\WindowsPowerShell\v1.0\powershell.exe"
    Arg     "-ExecutionPolicy"
    Arg     "Bypass"
    Arg     "-NoProfile"
    Arg     "-File"
    Arg     "C:\auditlog.ps1"
    <Exec>
        parse_json();
        $EventTime = parsedate($EventTime);
    </Exec>
</Input>{
"EventReceivedTime": "2018-03-01 02:12:45",
"SourceModuleName": "audit_ps",
"SourceModuleType": "im_exec",
"UserID": 18,
"LocationType": 0,
"EventName": null,
"MachineName": null,
"ItemName": null,
"EventData": "<Version><AllVersions/></Version><Recycle>1</Recycle>",
"Event": 4,
"UserName": "i:0#.w|test\\test",
"SourceName": null,
"SiteURL": "http://win-share",
"EventTime": "2018-03-01 02:12:12",
"EventSource": 0,
"Message": "The audited object is deleted.",
"DocLocation": "Shared Documents/document.txt",
"ItemID": "48341996-7844-4842-bef6-94b43ace0582",
"SiteID": "51108732-0903-4721-aae7-0f9fb5aebfc2",
"MachineIP": null,
"AppPrincipalID": 0,
"ItemType": 1
}# This script can be used with NXLog to fetch Audit logs via the SharePoint
# API. See the configurable options below. Based on:
# <http://shokochino-sharepointexperience.blogspot.ch/2013/05/create-auditing-reports-in-sharepoint.html>
#Requires -Version 3
# The timestamp is saved to this file for resuming.
$CacheFile = 'C:\nxlog_sharepoint_auditlog_position.txt'
# The database is queried at this interval in seconds.
$PollInterval = 10
# Allow this many seconds for new logs to be written to database.
$ReadDelay = 30
# Use this to enable debug logging (for testing outside of NXLog).
#$DebugPreference = 'Continue'
################################################################################
# If running 32-bit on a 64-bit system, run 64-bit PowerShell instead.
if ($env:PROCESSOR_ARCHITEW6432 -eq "AMD64") {
Write-Debug "Running 64-bit PowerShell."
&"$env:WINDIR\SysNative\WindowsPowerShell\v1.0\powershell.exe" `
-NonInteractive -NoProfile -ExecutionPolicy Bypass `
-File "$($myInvocation.InvocationName)" $args
exit $LASTEXITCODE
}
Add-PSSnapin "Microsoft.SharePoint.Powershell" -ErrorAction Stop
# Return description for event
function Event-Description {
param( $entry )
switch ($entry.Event) {
AuditMaskChange {"The audit flags are changed for the audited object."}
ChildDelete {"A child of the audited object is deleted."}
ChildMove {"A child of the audited object is moved."}
CheckIn {"A document is checked in."}
'Copy' {"The audited item is copied."}
Delete {"The audited object is deleted."}
EventsDeleted {"Some audit entries are deleted from SharePoint database."}
'Move' {"The audited object is moved."}
Search {"The audited object is searched."}
SecGroupCreate {"A group is created for the site collection (this action "`
+ "also generates an Update event)."}
SecGroupDelete {"A group on the site collection is deleted."}
SecGroupMemberAdd {"A user is added to a group."}
SecGroupMemberDelete {"A user is removed from a group."}
SecRoleBindBreakInherit {"A subsite's inheritance of permission level "`
+ "definitions (that is, role definitions) is severed."}
SecRoleBindInherit {"A subsite is set to inherit permission level "`
+ "definitions (that is, role definitions) from its parent."}
SecRoleBindUpdate {"The permissions of a user or group for the audited "`
+ "object are changed."}
SecRoleDefCreate {"A new permission level (a combination of permissions "`
+ "that are given to people holding a particular role for the site "`
+ "collection) is created."}
SecRoleDefDelete {"A permission level (a combination of permissions that "`
+ "are given to people holding a particular role for the site "`
+ "collection) is deleted."}
SecRoleDefModify {"A permission level (a combination of permissions that "`
+ "are given to people holding a particular role for the site "`
+ "collection) is modified."}
Update {"An existing object is updated."}
CheckOut {"A document is checked out."}
View {"The object is viewed by a user."}
ProfileChange {"Change in a profile that is associated with the object."}
SchemaChange {"Change in the schema of the object."}
Undelete {"Restoration of an object from the Recycle Bin."}
Workflow {"Access of the object as part of a workflow."}
FileFragmentWrite {"A File Fragment has been written for the file."}
Custom {"Custom action or event."}
default {"The event description could not be determined."}
}
}
# Get audit data from $site in range $start to $end. Timestamps should use
# seconds precision only. A record with timestamp equal to $start time is
# included in output; a record with timestamp equal to $end time is not.
function Get-Audit-Data {
param( $site, $start, $end )
Write-Debug "Getting audit log for $site.Url from $start to $end"
$query = New-Object -TypeName Microsoft.SharePoint.SPAuditQuery($site)
$query.setRangeStart($start.AddSeconds(-1))
$query.setRangeEnd($end)
$coll = $site.Audit.GetEntries($query)
$root = $site.RootWeb
for ($i=0; $i -le ($coll.Count)-1 ; $i++) {
# Get the entry item from the collection
$entry = $coll.Item($i)
# Find the current user name
foreach($User in $root.SiteUsers) {
if($entry.UserId -eq $User.Id) {
$UserName = $User.UserLogin
}
}
# Find the item name
foreach($List in $root.Lists) {
if($entry.ItemId -eq $List.Id) {
$ItemName = $List.Title
}
}
# Create hash table
$record = @{
# AuditData table fields
SiteID = $entry.SiteId;
ItemID = $entry.ItemId;
ItemType = $entry.ItemType;
UserID = $entry.UserId;
AppPrincipalID = $entry.AppPrincipalId;
MachineName = $entry.MachineName;
MachineIP = $entry.MachineIP;
DocLocation = $entry.DocLocation;
LocationType = $entry.LocationType;
EventTime = ($entry.Occurred.ToString('o') + "Z");
Event = $entry.Event;
EventName = $entry.EventName;
EventSource = $entry.EventSource;
SourceName = $entry.SourceName;
EventData = $entry.EventData;
# Additional fields
ItemName = $ItemName;
Message = Event-Description $entry;
SiteURL = $site.Url;
UserName = $UserName;
}
# Return record as JSON
$record | ConvertTo-Json -Compress | Write-Output
}
}
# Get position timestamp from cache file. On first run, create file using
# current time.
function Get-Position {
param( $file )
Try {
if (Test-Path $file) {
$time = (Get-Date (Get-Content $file -First 1))
$time = $time.ToUniversalTime()
$time = $time.AddTicks(-($time.Ticks % 10000000))
}
else {
$time = [System.DateTime]::UtcNow
$time = $time.AddTicks(-($time.Ticks % 10000000))
Save-Position $file $time
}
return $time
}
Catch {
Write-Error "Failed to read timestamp from position file."
exit 1
}
}
# Save position timestamp to cache file.
function Save-Position {
param( $file, $time )
Try { Out-File -FilePath $file -InputObject $time.ToString('o') }
Catch {
Write-Error "Failed to write timestamp to position file."
exit 1
}
}
# Main
Try {
$start = Get-Position $CacheFile
Write-Debug "Got start time of $($start.ToString('o'))."
$now = [System.DateTime]::UtcNow
$now = $now.AddTicks(-($now.Ticks % 10000000))
Write-Debug "Got current time of $($now.ToString('o'))."
$diff = ($now - $start).TotalSeconds
# Check whether waiting is required to comply with $ReadDelay.
if (($diff - $PollInterval) -lt $ReadDelay) {
$wait = $ReadDelay - $diff + $PollInterval
Write-Debug "Waiting $wait seconds to start collecting logs."
Start-Sleep -Seconds $wait
}
# Repeatedly read from the audit log
while($true) {
Write-Debug "Using range start time of $($start.ToString('o'))."
$now = [System.DateTime]::UtcNow
$now = $now.AddTicks(-($now.Ticks % 10000000))
$end = $now.AddSeconds(-($ReadDelay))
Write-Debug "Using range end time of $($end.ToString('o'))."
$sites = Get-SPSite -Limit All
foreach($site in $sites) { Get-Audit-Data $site $start $end }
Write-Debug "Saving position timestamp to cache file."
Save-Position $CacheFile $end
Write-Debug "Waiting $PollInterval seconds before reading again."
Start-Sleep -Seconds $PollInterval
$start = $end
}
}
Catch {
Write-Error "An unhandled exception occurred!"
exit 1
}Reading SharePoint audit logs from the database
It is also possible to read the audit logs directly from the SharePoint database.
This configuration collects audit events from the AuditData table in the
WSS_Content database.
The
datetime
data type is not timezone-aware, and the timestamps are stored
in UTC. Therefore, an offset is applied when setting the $EventTime
field in the configuration below.
|
<Input audit_db>
    Module              im_odbc
    ConnectionString    Driver={ODBC Driver 13 for SQL Server}; \
                        Server=SHARESERVE1; Database=WSS_Content; \
                        Trusted_Connection=yes
    IdType              timestamp

    # With ReadFromLast and MaxIdSQL, NXLog will start reading from the last
    # record when reading from the database for the first time.
    #ReadFromLast        TRUE
    #MaxIdSQL            SELECT MAX(Occurred) AS maxid FROM dbo.AuditData

    SQL     SELECT Occurred AS id, * FROM dbo.AuditData \
            WHERE Occurred > CAST(? AS datetime)
    <Exec>
        # Set $EventTime with correct time zone, remove incorrect fields
        $EventTime = parsedate(strftime($id, '%Y-%m-%d %H:%M:%SZ'));
        delete($id);
        delete($Occurred);
    </Exec>
</Input>
SharePoint Windows Event Log events
SharePoint generates Windows Event Log events according to the diagnostic log levels configured (see the SharePoint Diagnostic Logs section). NXLog Agent can be configured to collect logs from the Windows Event Log as shown below. For more information about collecting Windows Event Log events with NXLog Agent, see the Windows Event Log guide.
This configuration uses the im_msvistalog module to collect all logs from four SharePoint crimson channels, as well as Application channel events of Warning or higher level. The Application channel will include other non-SharePoint events. There may be other SharePoint events generated that will not be collected with this query, depending on the configuration and the channels used.
<Input eventlog>
    Module  im_msvistalog
    <QueryXML>
        <QueryList>
            <Query Id="0" Path="Application">
                <Select Path="Application">
                    *[System[(Level=1 or Level=2 or Level=3)]]</Select>
                <Select Path="System">
                    *[System[(Level=1 or Level=2 or Level=3)]]</Select>
                <Select Path="Microsoft-Office Server-Search/Operational">
                    *</Select>
                <Select Path="Microsoft-Office-EduServer Diagnostics">*</Select>
                <Select Path="Microsoft-SharePoint Products-Shared/Operational">
                    *</Select>
                <Select Path="Microsoft-SharePoint Products-Shared/Audit">*</Select>
            </Query>
        </QueryList>
    </QueryXML>
</Input>
SharePoint IIS Logs
SharePoint uses the Internet Information Server (IIS) to serve the configured sites as well as the Central Administration site. IIS generates its own logs.
See the Microsoft IIS chapter for more information about collecting events from IIS with NXLog Agent.