
Logstash
Logstash is a data collection and processing tool. It is often used as part of the ELK stack (Elasticsearch, Logstash, Kibana) to collect logs from various sources, normalize them, and forward them to Elasticsearch. NXLog Agent and Logstash can be configured to exchange log data between each other in various formats including JSON and syslog, and over different transport protocols such as TCP, UDP, and HTTP(S).
NXLog Agent as a data shipper for Logstash
Logstash can be resource-intensive and requires Java to run. For this reason, it is often used as an ingester, with different data shippers forwarding logs to it. NXLog Agent, with its small resource footprint, can act as a data shipper for Logstash with the benefit of being an all-in-one solution. For example, when using Elastic Beats, different Beats need to be installed for each log source, such as Filebeat for file-based logs, Winlogbeat for Windows Event Log and so on. An NXLog Agent installation can collect and process logs from different sources on the same host, all configured within a single configuration file.
NXLog Agent can also be used as a data shipper when it provides support for log sources that are not directly supported by Logstash. This includes collecting logs using Event Tracing for Windows or kernel log messages for Linux, BSD, and macOS. NXLog Agent also provides additional log processing power through custom scripts with support for Go, Java, Perl, Python, and Ruby.
NXLog Agent as an alternative to Logstash
NXLog Agent is a powerful log processing tool that is capable of ingesting, processing, and forwarding log data without the use of third-party tools. This includes the ability to forward data directly to Elasticsearch, and thus it can be used as a Logstash alternative. NXLog Agent also provides additional benefits over Logstash, some of which include:
-
Logstash depends on Java to run, requiring additional system resources. This also increases administrative work to deploy Java on production servers and keep installations up-to-date with security updates. On the other hand, NXLog Agent does not require Java and has a small resource footprint.
-
When using Logstash with different data shippers, each type of log source requires a special agent, each with its own configuration method. An NXLog Agent installation includes full functionality to collect, process, and forward logs. It can be configured as an end-to-end solution, or as an agent, forwarding logs to another NXLog Agent installation acting as a relay. This facilitates a more streamlined approach to deploying and managing your installations since it employs a single type of agent using a standardized, familiar method of configuration.
-
Logstash is an open-source software with a large repository of official and unofficial plugins. While this has its benefits, it also presents challenges when things don’t work as expected, or when plugins stop being maintained. All components in the NXLog Agent software, including input and output modules, extensions, and add-ons are developed, maintained, and supported by NXLog.
For more information and examples of how NXLog Agent can replace Logstash in the ELK stack, refer to the documentation on integrating with Elasticsearch and Kibana.
Sending logs to Logstash with NXLog Agent
Logstash supports data ingestion from various sources through its many input plugins and can process data in various formats by using filters and codec plugins. Likewise, NXLog Agent offers a vast selection of output modules and extensions that can format and send data in many of the formats and ingestion methods supported by Logstash. This section provides configuration examples for sending data from NXLog Agent to Logstash over TCP, UDP, and HTTPS. The examples show how to send data in two log formats commonly used with Logstash, JSON and syslog.
One of the easiest ways for Logstash to ingest data is to feed it logs in JSON format. This simplifies the Logstash configuration since logs can be parsed as structured data without any need to write complex grok filters. NXLog Agent provides support for JSON through its xm_json extension module, which can be used with any of the available input and output modules.
In this example, NXLog Agent is configured to collect logs from Event Tracing for Windows using the im_etw input module. Events are converted to JSON and then forwarded to Logstash over TCP using the om_tcp output module.
This configuration uses the Logstash TCP input plugin to listen for connections on port 5444. The json_lines codec is specified to process log records as JSON delimited by newline.
input {
  tcp {
    port  => 5444
    codec => json_lines
  }
}
The NXLog Agent configuration below uses the im_etw module to collect Microsoft Windows DNS Server audit events.
A Type field is added to each record to tag it as a DNS Server event.
This allows them to be easily found in searches on Elasticsearch/Kibana or other log analytics platforms.
Events are then converted to JSON and sent to Logstash over TCP.
<Extension json>
    Module      xm_json
</Extension>

<Input etw_dns>
    Module      im_etw
    Provider    Microsoft-Windows-DNSServer
    Exec        $Type = "DNS-Server";
    Exec        to_json();
</Input>

<Output logstash>
    Module      om_tcp
    Host        192.168.0.123:5444
</Output>The following is a sample DNS Server event as it is received by NXLog Agent.
<Event xmlns="http://schemas.microsoft.com/win/2004/08/events/event">
  <System>
    <Provider Name="Microsoft-Windows-DNSServer" Guid="{EB79061A-A566-4698-9119-3ED2807060E7}" />
    <EventID>516</EventID>
    <Version>0</Version>
    <Level>4</Level>
    <Task>5</Task>
    <Opcode>0</Opcode>
    <Keywords>0x4000000000100000</Keywords>
    <TimeCreated SystemTime="2021-03-02T08:59:30.763237500Z" />
    <EventRecordID>198</EventRecordID>
    <Correlation />
    <Execution ProcessID="1540" ThreadID="1696" />
    <Channel>Microsoft-Windows-DNSServer/Audit</Channel>
    <Computer>dns-1.example.com</Computer>
    <Security UserID="S-1-5-21-3379025547-2756628915-3927403441-500" />
  </System>
  <EventData>
    <Data Name="Type">1</Data>
    <Data Name="NAME">test-1.example.com</Data>
    <Data Name="TTL">0</Data>
    <Data Name="BufferSize">4</Data>
    <Data Name="RDATA">0A000007</Data>
    <Data Name="Zone">example.com</Data>
    <Data Name="ZoneScope">Default</Data>
    <Data Name="VirtualizationID">.</Data>
  </EventData>
</Event>The following JSON shows the above event after being processed by Logstash.
{
  "EventID": 516,
  "Severity": "INFO",
  "SourceModuleName": "etw_dns",
  "Domain": "EXAMPLE",
  "Type": "DNS-Server",
  "@timestamp": "2021-03-02T08:59:31.064Z",
  "Version": 0,
  "AccountType": "User",
  "EventTime": "2021-03-02T09:59:30.763240+01:00",
  "TTL": "0",
  "EventType": "INFO",
  "UserID": "S-1-5-21-3379025547-2756628915-3927403441-500",
  "SourceModuleType": "im_etw",
  "ChannelID": 17,
  "Keywords": "4611686018428436480",
  "Hostname": "WIN2016-AD",
  "BufferSize": "4",
  "RDATA": "0x0A000007",
  "port": 61258,
  "Zone": "example.com",
  "Flags": "EXTENDED_INFO|IS_64_BIT_HEADER|PROCESSOR_INDEX (577)",
  "OpcodeValue": 0,
  "NAME": "test-1.example.com",
  "VirtualizationID": ".",
  "EventReceivedTime": "2021-03-02T09:59:31.754431+01:00",
  "ExecutionProcessID": 1540,
  "AccountName": "Administrator",
  "ZoneScope": "Default",
  "host": "dns-1.example.com",
  "SourceName": "Microsoft-Windows-DNSServer",
  "@version": "1",
  "ExecutionThreadID": 1696,
  "SeverityValue": 2,
  "ProviderGuid": "{EB79061A-A566-4698-9119-3ED2807060E7}",
  "TaskValue": 5
}TCP communication between NXLog Agent and Logstash can be secured by using TLS. In this configuration, certificate-based authentication is used with a self-signed certificates. See Generating self-signed digital certificates for instructions on generating the required certificates.
This Logstash configuration uses the TCP input plugin to listen for connections on port 5444.
TLS/SSL is used, which requires clients to present a certificate that can be verified by any certificate authority listed in the array assigned to the ssl_certificate_authorities key in the configuration.
In this example, the array contains only one certificate authority.
input {
  tcp {
    port                        => 5444
    ssl_enable                  => true
    ssl_certificate_authorities => ["/path/to/root-CA.pem"]
    ssl_cert                    => "/path/to/root-CA.pem"
    ssl_key                     => "/path/to/root-CA.key"
    ssl_verify                  => true
  }
}
The NXLog Agent configuration below uses the om_ssl output module to send logs to Logstash using TLS.
The AllowUntrusted directive is set to FALSE, which means that Logstash must present a valid certificate that can be verified by the certificate authority specified in the CAFile directive.
<Output logstash>
    Module            om_ssl
    Host              192.168.0.123:5444
    CAFile            /path/to/root-CA.pem
    CertFile          /path/to/client-cert.pem
    CertKeyFile       /path/to/client-cert.key
    AllowUntrusted    FALSE
</Output>Syslog is a widely used log format, especially in Unix/Linux environments which has led many vendors to choose this log format for their appliances. NXLog Agent provides support for syslog through its xm_syslog extension module. The xm_syslog module can be used in combination with the om_tcp or om_udp output modules to forward syslog messages to Logstash.
This configuration uses the Logstash UDP input plugin to listen for connections on port 1514.
A grok filter is used to parse the log records as syslog messages. It is important to note that if logs do not conform to this pattern, they will fail to be parsed as structured data and will be tagged with _grokparsefailure.
input {
  udp {
    port  => 1514
  }
}

filter {
  grok {
    match => {
      "message" => "<%{POSINT:syslog_pri}>%{SYSLOGTIMESTAMP:syslog_timestamp} %{SYSLOGHOST:syslog_hostname} %{DATA:syslog_program}(?:\[%{POSINT:syslog_pid}\])?: %{GREEDYDATA:syslog_message}"
    }
  }
}
The NXLog Agent configuration below uses the om_udp module to forward logs to Logstash. The to_syslog_bsd() procedure provided by the xm_syslog module is used to send syslog messages in the RFC 3164 format expected by Logstash.
<Extension syslog>
    Module    xm_syslog
</Extension>

<Output logstash>
    Module    om_udp
    Host      192.168.0.123:1514
    Exec      to_syslog_bsd();
</Output>The following is a sample of a syslog message as sent from NXLog Agent to Logstash.
<13>Mar 8 12:25:35 server01 systemd[1]: Started NXLog daemon.The following JSON shows the above log sample after being processed by Logstash.
Note that the @version, @timestamp, and host fields are added by Logstash.
{
  "syslog_program": "systemd",
  "syslog_pid": "1",
  "syslog_message": "Started NXLog daemon.",
  "syslog_timestamp": "Mar  8 12:25:35",
  "syslog_pri": "13",
  "syslog_hostname": "server01",
  "message": "<13>Mar  8 12:25:35 server01 systemd[1]: Started NXLog daemon.",
  "@version": "1",
  "@timestamp": "2021-03-08T11:33:17.919Z",
  "host": "192.168.0.100"
}Logstash can receive logs over HTTP(S) using the HTTP input plugin and NXLog Agent can be configured to send logs to it using the om_http output module.
In this configuration, the Logstash http input plugin listens for connections on port 8080.
Certificate-based authentication is used with self-signed certificates.
See Generating self-signed digital certificates for instructions on generating the required certificates.
The json_lines codec is specified to process log records as JSON delimited by newline.
input {
  http {
    port                        => 8080
    codec                       => json_lines
    ssl                         => true
    ssl_certificate_authorities => ["/path/to/root-CA.pem"]
    ssl_certificate             => "/path/to/root-CA.pem"
    ssl_key                     => "/path/to/pkcs8-root-CA.key"
    ssl_verify_mode             => "force_peer"
  }
}
The NXLog Agent configuration below processes Apache access logs in the Combined Log Format.
The log data is parsed into fields and a Type field is added to each record. Log records are converted to JSON using the xm_json module and forwarded to Logstash over HTTPS.
Setting the BatchMode directive in the output instance to multiline specifies that log records should be sent in batches, one record per line.
<Extension json>
    Module                 xm_json
</Extension>

<Input apache_access>
    Module                 im_file
    File                   "path/to/file"
    <Exec>
        if $raw_event =~ /(?x)^(\S+)\ \S+\ (\S+)\ \[([^\]]+)\]\ \"(\S+)\ (.+)
                          \ HTTP\/\d\.\d\"\ (\S+)\ (\S+)\ \"([^\"]+)\"
                          \ \"([^\"]+)\"/
        {
            $Hostname = $1;
            if $2 != '-' $AccountName = $2;
            $EventTime = parsedate($3);
            $HTTPMethod = $4;
            $HTTPURL = $5;
            $HTTPResponseStatus = $6;
            if $7 != '-' $FileSize = $7;
            if $8 != '-' $HTTPReferer = $8;
            if $9 != '-' $HTTPUserAgent = $9;
            $Type = "Apache-Access";
        }
    </Exec>
</Input>

<Output logstash>
    Module                 om_http
    URL                    https://192.168.0.123:8080
    BatchMode              multiline
    HTTPSCAFile            /path/to/root-CA.pem
    HTTPSCertFile          /path/to/client-cert.pem
    HTTPSCertKeyFile       /path/to/client-cert.key
    HTTPSAllowUntrusted    FALSE
    Exec                   to_json();
</Output>The following is an Apache access log sample received by NXLog Agent.
83.149.9.216 - - [02/Mar/2021:16:13:44 +0000] "GET /presentations/logstash/plugin/zoom-js/zoom.js HTTP/1.1" 200 7697 "http://example.com/presentations/logstash/" "Mozilla/5.0 (Macintosh; Intel Mac OS X 10_9_1) AppleWebKit/537.36 (KHTML, like Gecko) Chrome/32.0.1700.77 Safari/537.36"The following JSON shows the above log sample as output by Logstash.
Note that the @version, @timestamp, host, and headers fields are added by Logstash.
{
  "HTTPUserAgent": "Mozilla/5.0 (Macintosh; Intel Mac OS X 10_9_1) AppleWebKit/537.36 (KHTML, like Gecko) Chrome/32.0.1700.77 Safari/537.36",
  "HTTPReferer": "http://example.com/presentations/logstash/",
  "HTTPMethod": "GET",
  "Hostname": "83.149.9.216",
  "HTTPResponseStatus": "200",
  "EventReceivedTime": "2021-03-02T16:18:26.139421+01:00",
  "SourceModuleType": "im_file",
  "EventTime": "2021-03-02T16:13:44.000000+01:00",
  "SourceModuleName": "apache_access",
  "HTTPURL": "/presentations/logstash/plugin/zoom-js/zoom.js",
  "FileSize": "7697",
  "Type": "Apache-Access",
  "@version": "1",
  "@timestamp": "2021-03-02T15:18:29.568Z",
  "host": "192.168.1.100",
  "headers": {
    "content_length": "2212",
    "keep_alive": "timeout=300",
    "request_path": "/",
    "content_type": "text/plain",
    "http_accept": null,
    "http_user_agent": "nxlog",
    "http_version": "HTTP/1.1",
    "connection": "keep-alive",
    "request_method": "POST",
    "http_host": "localhost:8080"
  }
}| NXLog Agent can parse log records in any format using the available extension modules or through the use of regular expressions and other string manipulation functions. |
See Parse common event formats in the NXLog Platform User Guide for more information and examples.
Receiving logs from Logstash with NXLog Agent
NXLog Agent can receive and process data in many of the output methods and data formats supported by Logstash. See the Reference Manual for a complete list of input modules and extensions.
In this configuration, NXLog Agent uses the im_tcp input module to listen for connections on port 5445. It expects to receive log records as JSON delimited by newline and uses the xm_json module to parse log records into fields.
<Extension json>
    Module        xm_json
</Extension>

<Input tcp_listen>
    Module        im_tcp
    ListenAddr    0.0.0.0:5445
    Exec          parse_json();
</Input>
The Logstash configuration below uses the TCP output plugin to send logs to NXLog Agent. Although the TCP plugin documentation states that each JSON event is separated by a newline, this is currently not the case thus the json_lines codec is required as a workaround.
output {
  tcp {
    host  => "192.168.0.100"
    port  => 5445
    codec => json_lines
  }
}In this configuration, NXLog Agent uses the im_udp input module to listen for connections on port 1514. It expects to receive syslog messages in RFC 5424 format and uses the xm_syslog module to parse log records into fields.
<Extension syslog>
    Module        xm_syslog
</Extension>

<Input udp_listen>
    Module        im_udp
    ListenAddr    0.0.0.0:1514
    Exec          parse_syslog_ietf();
</Input>
The Logstash configuration below uses the syslog output plugin to send logs to NXLog Agent. This plugin is not installed by default. To install it, execute the following command within the Logstash home directory:
# bin/logstash-plugin install logstash-output-syslogoutput {
syslog {
host => "192.168.0.100"
port => 1514
protocol => "rfc5424"
}
}Verifying data output from Logstash
Logstash can output data in several ways thus the method to verify the output depends on the Logstash configuration. For testing purposes, it can be configured to output log records to the shell’s standard output (stdout) where Logstash is running or to a local file. Multiple output methods can be specified simultaneously. If Logstash is running as part of the ELK stack, see Verifying data in Elasticsearch/Kibana.
Verifying data in Elasticsearch/Kibana
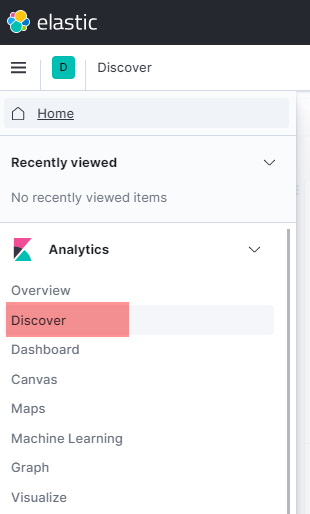
When Logstash is used as part of the ELK stack it is configured to forward logs to Elasticsearch while Kibana handles data visualization. One way to verify the reception of log data is to launch the Kibana web interface and navigate to Analytics > Discover.
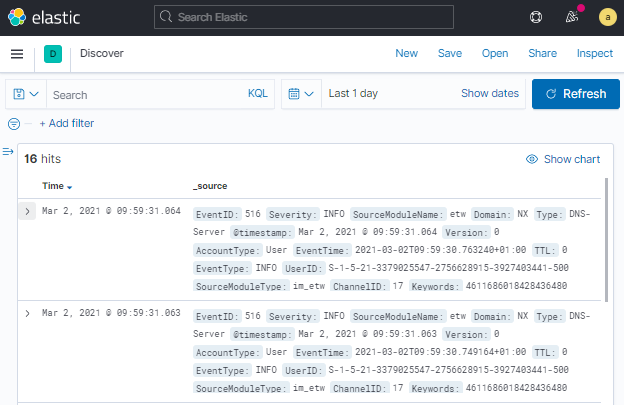
By default, only log events received during the last 15 minutes are displayed. This image shows the Kibana web interface configured to display log events received during the last day.
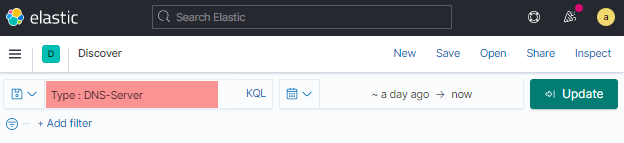
Filters can be defined to show only log records of interest. The following image shows a filter where only records having the value DNS-Server for the Type field will be displayed.
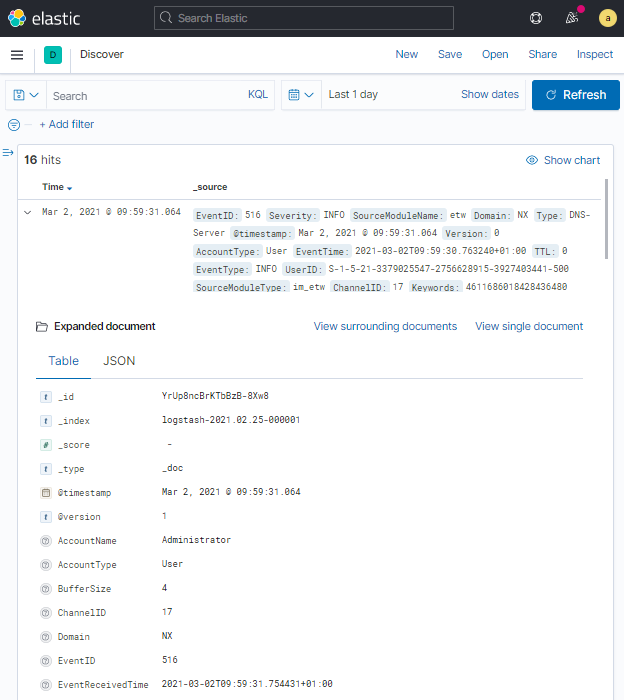
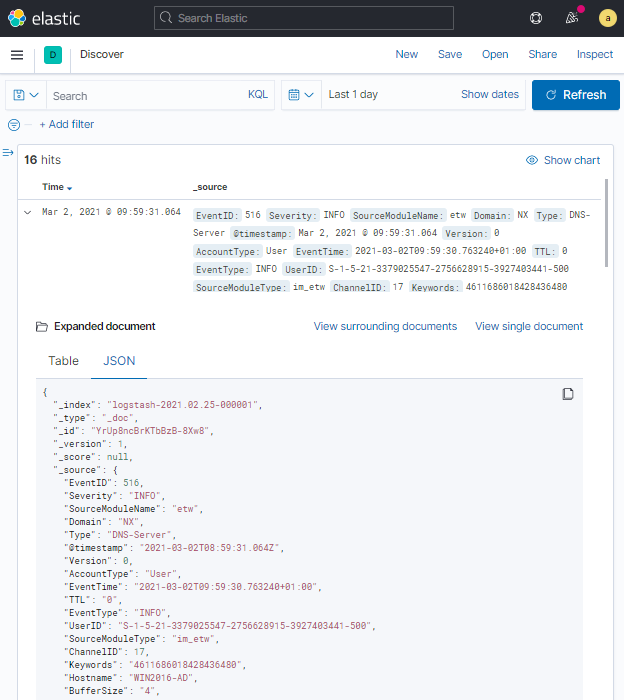
Kibana offers two viewing modes for log records. This image depicts a Microsoft Windows DNS Server event in Table view mode.
The following image depicts the same DNS Server event in JSON view mode.
Generating self-signed digital certificates
You can follow these steps that use the OpenSSL command line tool to create self-signed certificates for Logstash with NXLog Agent as a client.
-
Create the Certificate Authority (CA) certificate. These commands will create a root CA private key file for signing certificates (
root-CA.key) and a self-signed root CA certificate file (root-CA.pem).$ openssl genrsa -out root-CA.key 2048 $ openssl req -x509 -new -nodes -key root-CA.key -sha256 -days 1024 -out root-CA.pem -
Create an OpenSSL configuration file for the NXLog Agent client certificate and name it
client_options.conf. Replace the values under[req_distinguished_name]and[alt_names]accordingly.client_options.conf[req] distinguished_name = req_distinguished_name x509_extensions = v3_req prompt = no [req_distinguished_name] CN = nxlog-host.example.com [v3_req] keyUsage = keyEncipherment, dataEncipherment extendedKeyUsage = serverAuth subjectAltName = @alt_names [alt_names] DNS.1 = 192.168.1.100 -
Generate the client key and certificate signing request:
$ openssl genrsa -out client-cert.key 2048 $ openssl req -new -key client-cert.key -out client-cert.csr -config client_options.conf -
Generate the client certificate to be used by NXLog Agent:
$ openssl x509 -req -in client-cert.csr -CA root-CA.pem -CAkey root-CA.key -CAcreateserial -out client-cert.pem -days 1024 -sha256 -
If using the Logstash HTTP input module the CA key must be in the PKCS8 format. The following command converts the previously created PKCS1 key to the required PKCS8 format:
$ openssl pkcs8 -topk8 -inform PEM -outform PEM -nocrypt -in root-CA.key -out pkcs8-root-CA.key