Nagios Log Server
Nagios Log Server provides centralized management, monitoring, and analysis of logging data. It utilizes the ELK (Elasticsearch, Logstash, and Kibana) stack. NXLog Agent can be customized to send log data to the Nagios Log Server over TCP, UDP, and TLS/SSL protocols.
Installation and configuration of Nagios Log Server
To learn more about installing and configuring Nagios Log Server, see the Manual Installation Instructions and Administrator Guide on the Nagios website.
By default, Nagios Log Server does not require any post-installation configuration which means logs can be received from NXLog Agent right away.
NXLog Agent configuration
NXLog Agent can be configured to send the logs it collects to Nagios Log Server.
To see the IP address and ports of the Nagios Log Server instance, open the Configure page and find the Configuration Editor section.
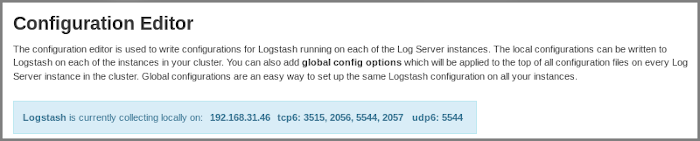
These addresses and ports will be used in the examples below.
The configuration below reads systemd messages using the
im_systemd module and selects only those entries which contain
the sshd character combination.
The selected messages are processed with the xm_kvp module and
converted to JSON using the xm_json module.
Sending over TCP is carried out using the om_tcp module.
<Extension kvp>
    Module          xm_kvp
    KVDelimiter     =
    KVPDelimiter    " "
</Extension>

<Extension json>
    Module          xm_json
</Extension>

<Input systemd>
    Module          im_systemd
    ReadFromLast    TRUE
    Exec if not ($raw_event =~ /sshd/) drop();
</Input>

<Output out>
    Module          om_tcp
    Host            192.168.31.179
    Port            3515
    <Exec>
        kvp->parse_kvp();
        to_json();
    </Exec>
</Output>
Below is the event sample of a log message which is sent over TCP.
{
  "Severity": "info",
  "SeverityValue": 6,
  "Facility": "syslog",
  "FacilityValue": 4,
  "Message": "Accepted password for administrator from 192.168.31.179 port 46534 ssh2",
  "SourceName": "sshd",
  "ProcessID": 3168,
  "User": "root",
  "Group": "root",
  "ProcessName": "sshd",
  "ProcessExecutable": "/usr/sbin/sshd",
  "ProcessCmdLine": "sshd: administrator [priv]",
  "Capabilities": "3fffffffff",
  "SystemdCGroup": "/system.slice/ssh.service",
  "SystemdUnit": "ssh.service",
  "SystemdSlice": "system.slice",
  "SelinuxContext": "unconfined\n",
  "EventTime": "2020-03-25 18:59:53",
  "BootID": "1eb2f28ae8064c7a954e2420be54a7f2",
  "MachineID": "0823d4a95f464afeb0021a7e75a1b693",
  "SysInvID": "984c8a16fd20462a9ac8c0682081979c",
  "Hostname": "ubuntu",
  "Transport": "syslog",
  "EventReceivedTime": "2020-03-25T18:59:53.565177+00:00",
  "SourceModuleName": "systemd",
  "SourceModuleType": "im_systemd"
}The configuration below reads Windows Event Log entries and selects only those
entries which contain IDs 4624 and 4625 using
the im_msvistalog module.
The collected logs are then converted to JSON using the xm_json
module after the Message field is deleted from the entry.
Sending over UDP is carried out using the om_udp module.
<Extension json>
    Module          xm_json
</Extension>

<Input in_eventlog>
    Module          im_msvistalog
	<QueryXML>
        <QueryList>
            <Query Id="0">
               <Select Path="Security">
               *[System[Level=0 and (EventID=4624 or EventID=4625)]]</Select>
            </Query>
         </QueryList>
    </QueryXML>
    <Exec>
        delete($Message);
        json->to_json();
    </Exec>
</Input>

<Output out>
    Module          om_udp
    Host            192.168.31.179
    Port            5544
    Exec            to_json();
</Output>
Below is the event sample of a log message which is sent over UDP.
{
  "EventTime": "2020-03-22T13:48:55.455545-07:00",
  "Hostname": "WIN-IVR26CIVSF6",
  "Keywords": "9232379236109516800",
  "EventType": "AUDIT_SUCCESS",
  "SeverityValue": 2,
  "Severity": "INFO",
  "EventID": 4624,
  "SourceName": "Microsoft-Windows-Security-Auditing",
  "ProviderGuid": "{54849625-5478-4994-A5BA-3E3B0328C30D}",
  "Version": 2,
  "TaskValue": 12544,
  "OpcodeValue": 0,
  "RecordNumber": 15033,
  "ActivityID": "{CFEB8893-00D2-0000-E289-EBCFD200D601}",
  "ExecutionProcessID": 532,
  "ExecutionThreadID": 572,
  "Channel": "Security",
  "Category": "Logon",
  "Opcode": "Info",
  "SubjectUserSid": "S-1-5-18",
  "SubjectUserName": "WIN-IVR26CIVSF6$",
  "SubjectDomainName": "WORKGROUP",
  "SubjectLogonId": "0x3e7",
  "TargetUserSid": "S-1-5-90-0-6",
  "TargetUserName": "DWM-6",
  "TargetDomainName": "Window Manager",
  "TargetLogonId": "0x1c8f13",
  "LogonType": "2",
  "LogonProcessName": "Advapi  ",
  "AuthenticationPackageName": "Negotiate",
  "WorkstationName": "-",
  "LogonGuid": "{00000000-0000-0000-0000-000000000000}",
  "TransmittedServices": "-",
  "LmPackageName": "-",
  "KeyLength": "0",
  "ProcessId": "0x848",
  "ProcessName": "C:\\Windows\\System32\\winlogon.exe",
  "IpAddress": "-",
  "IpPort": "-",
  "ImpersonationLevel": "%%1833",
  "RestrictedAdminMode": "-",
  "TargetOutboundUserName": "-",
  "TargetOutboundDomainName": "-",
  "VirtualAccount": "%%1842",
  "TargetLinkedLogonId": "0x1c8f24",
  "ElevatedToken": "%%1842",
  "EventReceivedTime": "2020-03-22T13:48:56.870657-07:00",
  "SourceModuleName": "in",
  "SourceModuleType": "im_msvistalog"
}
Configuration of NXLog Agent for sending logs over TLS/SSL is already described in Sending NXLogs With TLS on the Nagios website.
To read more about encrypted data transfer, see Configure TLS/SSL and the TLS/SSL (om_ssl) output module documentation.
Other examples of sending log data using NXLog Agent from the Nagios website:
Verifying data collection
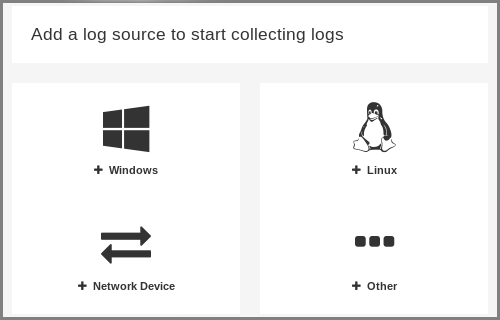
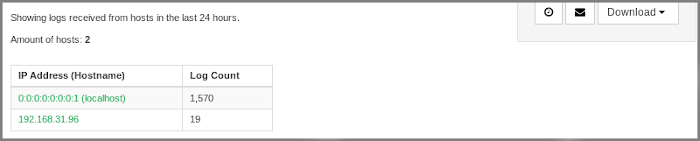
To verify successful collection by the Nagios Log Server, open the Home page and add the relevant log source.
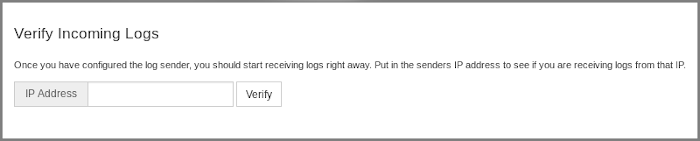
On the log source page, find the Verify Incoming Logs section, type in the IP address of the NXLog Agent server and click the Verify button. The verification should show several log entries that have already been accepted by the Log Server from the specified IP address.
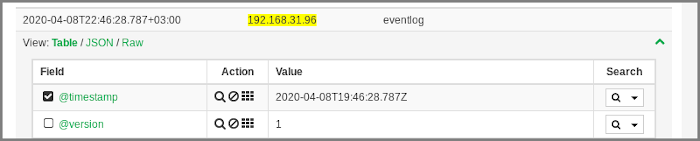
To observe the collected entries, go to the Reports page and click the required IP address (hostname) in the table.
The table with log entries will open. To expand information about the specified entry, click its line in the table.
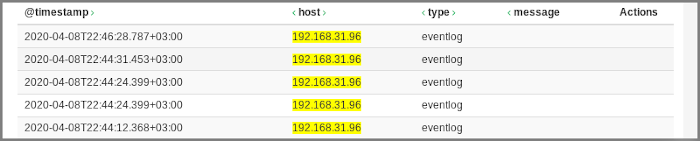
Each entry contains structured information about its fields and values.