Elasticsearch and Kibana
Elasticsearch is a search engine and document database commonly used to store logging data. Kibana is a popular user interface and querying front end for Elasticsearch, often used with the Logstash data collection tool—together forming the ELK stack (Elasticsearch, Logstash, and Kibana).
However, Logstash is not required to load data into Elasticsearch. NXLog Agent can also do this by sending logs over HTTPS and offers several advantages over Logstash—this is the KEN stack (Kibana, Elasticsearch, and NXLog Agent).
-
Because Logstash is written in Ruby and requires Java, its system resource requirements are relatively high. On the other hand, NXLog Agent has a small resource footprint. Consequently, many ELK users recommend it as the log collector of choice for Windows and Linux.
-
Due to Logstash’s dependency on the Java Runtime Environment, system administrators are required to deploy it on production servers and regularly maintain Java security updates. NXLog Agent does not require Java.
-
Elastic’s Logstash
wmiinput plugin creates events based on the results of a WMI query. This method incurs a significant performance penalty. NXLog Agent uses the native Windows Event Log API to capture Windows events more efficiently.
Sending logs to Elasticsearch
Consult the Elasticsearch Reference and the Kibana User Guide for more information about installing and configuring Elasticsearch and Kibana.
Elasticsearch can receive logs via its REST API. For NXLog Agent to be able to connect to the API, it requires an API key and the Elasticsearch CA certificate. Optionally, you can create an Elasticsearch index template to define the settings to use when creating an index.
Creating an API key
-
Log in to your Kibana instance, and from the side menu, navigate to Management > Stack Management.
-
From the management menu, under Security, click API keys.
-
Click the Create API key button in the top right.
-
Enter a Name that identifies the key.
-
Switch on Restrict privileges and enter a role descriptor that restricts access to the NXLog Agent index, e.g.:
{
  "nxlog": {
    "indices": [
      {
        "names": [
          "nxlog*"
        ],
        "privileges": [
          "all"
        ],
        "allow_restricted_indices": false
      }
    ]
  }
}
Refer to the Elasticsearch Create API key documentation for more details on defining role descriptors.
-
Click the Create API key button.
-
The new API key will be displayed. You will need the Base64 value for the NXLog Agent configuration.

Make sure you immediately save the key to a safe, accessible location because you will not be able to retrieve it once you navigate away from this screen.
Retrieving the Elasticsearch CA certificate
Upon installation, Elasticsearch version 8.x creates a CA certificate needed for signing the regular certificates it uses for secure HTTPS communication.
See the Elasticsearch documentation on Security certificates and keys for more information.
The CA certificate is saved in the Elasticsearch configuration directory, which defaults to /etc/elasticsearch/certs on Linux-based systems.
Copy http_ca.crt to a location accessible by NXLog Agent, such as /opt/nxlog/cert, the default NXLog Agent certificates directory.
You will need to specify the path to the CA certificate in the NXLog Agent configuration.
Elasticsearch version 7.x and older do not have security switched on by default. See Configure security for the Elastic Stack in the Elasticsearch Guide [7.17] for more information on securing your Elasticsearch 7.x instance. For older Elasticsearch versions, consult the documentation for your specific version
If you have configured Elasticsearch to use your organization’s CA certificate, use that certificate instead.
Creating an Elasticsearch index template
In Elasticsearch, mapping refers to defining how data is stored, including fields and their data types. Elasticsearch performs dynamic mapping, assessing the data it receives and automatically assigning a data type. Dynamic mapping is helpful in some cases, such as when you’re getting started and still experimenting with the data. However, explicit mapping is preferable once you have a well-defined data schema. See Mapping in the Elasticsearch documentation for more information.
To define a mapping in Elasticsearch, you need to create an index template, which can be made up of one or more component templates. Component templates are reusable, making them useful for defining a mapping for standard data. For example, the following component template maps data for common NXLog Agent fields.
{
  "template": {
    "mappings": {
      "properties": {
        "event.time.received": {
          "type": "date"
        },
        "@timestamp": {
          "type": "date"
        },
        "nxlog.module.name": {
          "type": "keyword"
        },
        "nxlog.module.type": {
          "type": "keyword"
        },
        "nxlog.version": {
          "type": "keyword"
        }
      }
    }
  }
}
The following index template uses the component template above and defines a mapping for syslog data.
It sets the dynamic parameter at the mapping level to strict, meaning that if Elasticsearch encounters an unknown field, it throws an error and prevents the document from being indexed.
The dynamic parameter can also be set at the field level.
{
  "index_patterns": ["nxlog*"],
  "template": {
    "mappings": {
      "dynamic": "strict",
      "_source": {
        "enabled": true
      },
      "properties": {
        "service.type": {
          "type": "keyword"
        },
        "event.severity": {
          "type": "keyword"
        },
        "log.syslog.facility.name": {
          "type": "keyword"
        },
        "log.syslog.severity.code": {
          "type": "integer"
        },
        "event.original": {
          "type": "text"
        },
        "log.syslog.severity.name": {
          "type": "keyword"
        },
        "log.level": {
          "type": "integer"
        },
        "host.hostname": {
          "type": "keyword"
        },
        "process.pid": {
          "type": "integer"
        },
        "message": {
          "type": "text"
        },
        "log.syslog.facility.code": {
          "type": "integer"
        }
       }
    }
  },
  "priority": 500,
  "composed_of": ["nxlog-common"],
  "version": 1.0
}
See our Elastic Common Schema (ECS) integration guide for more information on creating an NXLog Agent Elasticsearch mapping and normalizing data.
Configuring NXLog Agent to send logs to Elasticsearch
NXLog Agent provides the om_elasticsearch output module for sending logs to Elasticsearch in bulk via the REST API. You can also use the om_http module. However, because it sends a request to the Elasticsearch REST API for each event, the maximum logging throughput is limited by HTTP request and response latency. Therefore, the om_http module is only suitable for low-volume logging scenarios.
This configuration uses the im_file input module to collect Linux system logs from a file. It parses log records into structured data with the parse_syslog() procedure of the xm_syslog module and then normalizes fields according to the Elasticsearch index template using the xm_rewrite module.
The elasticsearch output instance converts records to JSON using the to_json() procedure of the xm_json module before forwarding them to Elasticsearch with the om_elasticsearch output module.
<Extension _json>
    Module              xm_json
</Extension>

<Extension syslog_ecs>
    Module              xm_rewrite
    Rename              EventTime, @timestamp
    Rename              EventReceivedTime, event.time.received
    Rename              Severity, event.severity
    Rename              SeverityValue, log.level
    Rename              SyslogSeverityValue, log.syslog.severity.code
    Rename              SyslogSeverity, log.syslog.severity.name
    Rename              SyslogFacilityValue, log.syslog.facility.code
    Rename              SyslogFacility, log.syslog.facility.name
    Rename              ProcessID, process.pid
    Rename              SourceName, service.type
    Rename              Message, message
    Rename              Hostname, host.hostname
    Rename              SourceModuleType, nxlog.module.type
    Rename              SourceModuleName, nxlog.module.name
    Exec                ${nxlog.version} = nxlog_version();
    Exec                ${event.original} = $raw_event;
</Extension>

<Input system_messages>
    Module              im_file
    File                '/var/log/syslog'
    <Exec>
        parse_syslog();
        syslog_ecs->process();
    </Exec>
</Input>

<Output elasticsearch>
    Module              om_elasticsearch
    URL                 https://localhost:9200/_bulk
    AddHeader           Authorization: ApiKey <your_api_key> (1)
    HTTPSCAFile         /opt/nxlog/cert/elastic_http_ca.crt (2)

    # Create an index daily
    Index               strftime(${@timestamp}, "nxlog-%Y%m%d") (3)

    # Needs to be set to TRUE for Elasticsearch version 8.0 and newer,
    # optional for version 7.x, and FALSE for older versions
    NoDefaultIndexType  TRUE (4)

    Exec                to_json();
</Output>| 1 | The AddHeader directive is required for authenticating with the Elasticsearch REST API. See Creating an Elasticsearch API key. |
| 2 | The HTTPSCAFile directive specifies the path to the Elasticsearch CA certificate. |
| 3 | The Index directive creates an Elasticsearch index daily in the format nxlog-yyyymmdd. |
| 4 | The NoDefaultIndexType directive is set to TRUE, indicating that the API request should not include a mapping type since, as of Elasticsearch version 8.0, types are no longer supported. |
Jun 26 15:44:26 NXLog-Ubuntu-1 systemd[1]: Started NXLog daemon.{
"event.time.received": "2022-06-26T15:44:26.642849+02:00",
"nxlog.module.name": "system_messages",
"nxlog.module.type": "im_file",
"log.syslog.facility.code": 1,
"log.syslog.facility.name": "USER",
"log.syslog.severity.code": 5,
"log.syslog.severity.name": "NOTICE",
"log.level": 2,
"event.severity": "INFO",
"host.hostname": "NXLog-Ubuntu-1",
"@timestamp": "2022-06-26T15:44:26.000000+02:00",
"service.type": "systemd",
"process.pid": 1,
"message": "Started NXLog daemon.",
"nxlog.version": "5.6",
"event.original": "Jun 26 15:44:26 NXLog-Ubuntu-1 systemd[1]: Started NXLog daemon."
}This configuration uses the om_http output module to forward logs to the Elasticsearch REST API, one event per request. Before forwarding, it converts events to JSON using the to_json() procedure of the xm_json module.
<Extension _json>
    Module         xm_json
</Extension>

<Output elasticsearch>
    Module         om_http
    URL            https://localhost:9200
    ContentType    application/json
    AddHeader      Authorization: ApiKey <your_api_key> (1)
    HTTPSCAFile    /opt/nxlog/cert/elastic_http_ca.crt (2)
    <Exec>
        set_http_request_path(strftime(${@timestamp}, "nxlog-%Y%m%d/_doc")); (3)
        to_json();
    </Exec>
</Output>| 1 | The AddHeader directive is required for authenticating with the Elasticsearch REST API. See Creating an Elasticsearch API key. |
| 2 | The HTTPSCAFile directive specifies the path to the Elasticsearch CA certificate. |
| 3 | The set_http_request_path() procedure appends the path to the URL, creating an Elasticsearch index daily in the format nxlog-yyyymmdd.
See the Elasticsearch Index API documentation for more information. |
Elasticsearch does its internal parsing for timestamp fields.
Dates need to be in a format supported by Elasticsearch, or you risk losing data.
If using functions or procedures provided by the xm_json module, the date format defaults to YYYY-MM-DDThh:mm:ss.sTZ, an Elasticsearch-supported format.
To specify a different date format, use the DateFormat module directive of xm_json.
If you are not using the xm_json module, you must set the DateFormat global directive; otherwise, Elasticsearch will not recognize the default NXLog Agent date format YYYY-MM-DD hh:mm:ss.
For more information, see Date format in Elasticsearch in the Reference Manual.
|
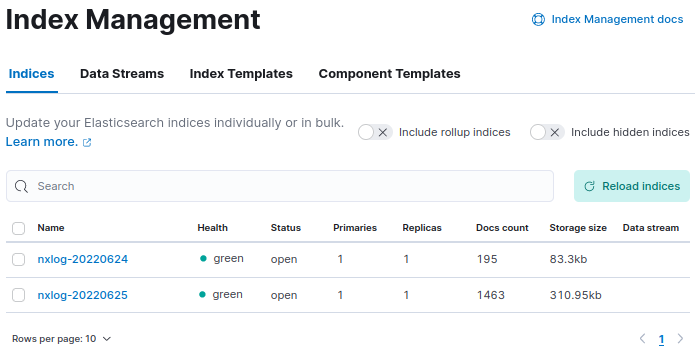
Once NXLog Agent starts processing and forwarding data, verify that Elasticsearch is indexing the data.
Open your Kibana instance, and from the side menu, navigate to Management > Stack Management.
Click on Index Management under Data, and you should see the nxlog* index with an increasing Docs count.
Elasticsearch data size limitation
Elasticsearch comes with a predefined set of limitations for the size of the data it will ingest, and it will not index documents that exceed the limit. These limitations can prevent ingestion when forwarding data in batches with NXLog Agent. The following default HTTP settings can be increased to avoid this problem:
http.max_content_length: 100mb
http.max_initial_line_length: 32kb
http.max_header_size: 32kb
Refer to the Elasticsearch Advanced HTTP Settings documentation for more information.
Forwarding logs to Logstash
NXLog Agent can be configured as a data shipper for forwarding logs to Logstash. It can send logs in various formats, such as JSON and syslog while using different transport protocols such as TCP, UDP, or HTTP(S).
The example below provides a basic configuration for sending logs to Logstash in JSON format over TCP. You can find further information and examples of how to send logs to Logstash in the Logstash integration guide.
-
Set up a configuration on the Logstash server to process incoming event data from NXLog Agent.
.logstash.conf
input {
  tcp {
    codec => json_lines { charset => CP1252 }
    port => "3515"
    tags => [ "tcpjson" ]
  }
}
filter {
  date {
    locale => "en"
    timezone => "Etc/GMT"
    match => [ "EventTime", "YYYY-MM-ddTHH:mm:ss.sZZ" ]
  }
}
output {
  elasticsearch {
    host => localhost
  }
  stdout { codec => rubydebug }
}
+
|
The Although the im_msvistalog module converts data to UTF-8, Logstash seems to have trouble parsing this most popular character encoding.
The |
-
Configure NXLog Agent.
nxlog.conf<Extension _json> Module xm_json </Extension> <Output logstash_tcp> Module om_tcp Host 10.1.1.1:3515 Exec to_json(); </Output> -
Restart NXLog Agent.
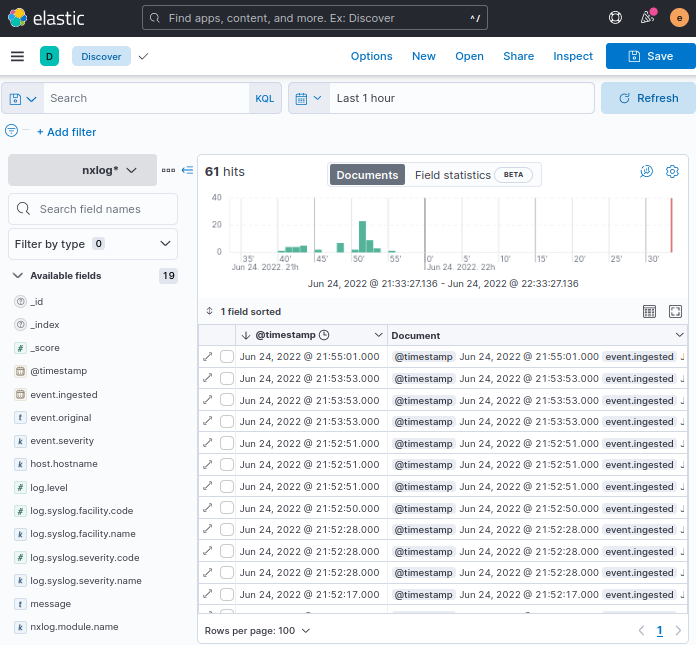
Verifying data in Kibana
Reception of log data can be verified using the Kibana web interface:
-
Log in to your Kibana instance, and from the side menu, navigate to Analytics > Discover.
-
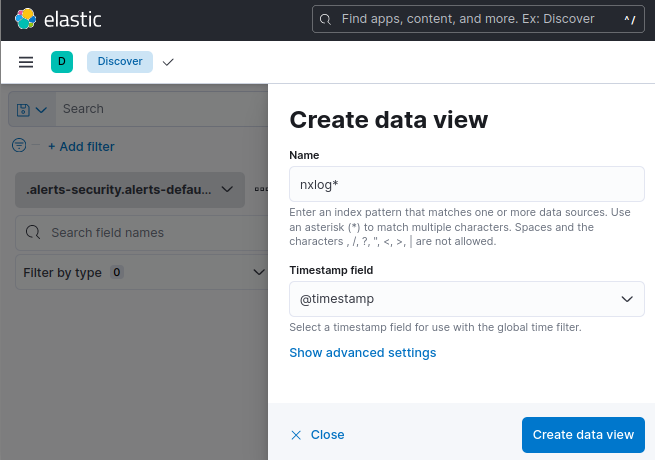
Click on … next to the list of data views and select Create new data view.
-
In the Name field, enter the index pattern, e.g.,
nxlog*. -
Set the Timestamp field to the event time field, e.g., @timestamp.
-
Click the Create data view button.
-
Events for the last 15 minutes will be displayed by default. Use the date selector to change the date range and click the Update button.