
Collect logs from Windows DNS Server
Windows DNS Server is a Windows server role that acts as the Global Catalog server for the forest and domain within Active Directory. DNS logging is an essential part of security monitoring.
NXLog can collect Windows DNS Server logs from various sources such as ETW providers, file-based DNS debug logs, Sysmon for DNS query logs, and Windows Event Log for DNS event sources. In addition, NXLog provides support for passively monitoring DNS-related network traffic.
NXLog’s advanced log parsing capabilities make it easy to aggregate and normalize all your DNS logs coming from the various sources and formats, then send them to a destination of your choice, be it a SIEM or analytics system where you can further examine your DNS logs. Its flexibility and speed make NXLog the ideal candidate for collecting DNS logs from any Windows system.
Windows DNS logging overview
NXLog offers four general event logging facilities for logging DNS events generated by Windows DNS Server and its clients:
The following table maps some of the key features and attributes unique to each NXLog logging facility available for Windows DNS logging and monitoring.
| DNS Logging or Tracing Type | Provider or Channel | Module(s) | Feature(s) | Requirements |
|---|---|---|---|---|
Audit and Analytical |
Microsoft-Windows-DNSServer |
Preferred method. |
Server versions 2012 R2 and later |
|
Debug |
Fast. |
Windows Server versions 2008 R2, 2012 R2, and 2016 |
||
Debug |
Fast. |
|||
Active Directory auditing |
Microsoft-Windows-Security-Auditing |
Systems without native DNS auditing |
Windows 8.1 or later |
|
Native DNS auditing |
Microsoft-Windows-DNSServer/Audit |
Preferred method for collecting DNS audit logs |
Windows Server 2016, or 2012 R2 with hotfix 2956577 |
|
Sysmon |
Microsoft-Windows-Sysmon/Operational |
Only DNS client query logging, but it is the only way to obtain the name and path of the client application executing the query. |
Windows 8.1 or later |
|
DNS Client |
Microsoft-Windows-DNS-Client/Operational |
Another source of DNS client query logging. |
Windows 8.1 or later |
DNS logging via ETW providers
Enhanced Windows DNS Event Log logging is available from Event Tracing for Windows providers. There are two event categories:
-
Windows DNS Server Audit Events that are enabled by default. An audit event is logged whenever the DNS Server settings, zones, or resource records are changed. Such DNS events are of utmost importance for security audits. Each of the 53 audit event types is identified by a unique
EventIDdocumented in the Audit events table of Microsoft’s documentation. TheTypecolumn in this table contains a short description of the event; however, it is not included in the actual logged event. For example, if a new zone is created, it is impossible to search for an event containingRecord create. Instead, onlyEventID: 515is available for identifying this type of event. -
Windows DNS Server Analytical Events that must be specifically enabled. They represent the bulk of DNS events, primarily lookups and other queries, and can be large in volume. The Analytic events table of Microsoft’s documentation lists each of the 23 types of the monitored events. Just like with
Audit Events, Windows logs theEventID, but not the more descriptiveTypefield. According to the Audit and analytic event logging section of Microsoft’s documentation, when processing 100,000 queries per second (QPS) on modern hardware, the expected reduction in performance is around 5% if Analytical Event logging is enabled.
Event tracing offers significant advantages over DNS Debug Logging in terms of architecture, flexibility, configurability, and performance. ETW events can be read directly without requiring events to be first written to disk. However, ETW is not available on older Windows systems. To maintain its performance, it is by design a "best effort" framework and consequently does not guarantee capturing all events.
For more information, see the Installing and enabling DNS diagnostic logging section on Microsoft Docs.
With Analytical Logging enabled, NXLog can use the im_etw module to collect DNS logs from the Microsoft-Windows-DNSServer ETW provider.
This is the preferred method for collecting logs from Windows Server versions 2012 R2 and later.
| On Windows Server 2012 R2, this feature is provided by hotfix 2956577. |
The following configuration collects DNS logs via ETW from the Microsoft-Windows-DNSServer provider using the im_etw module.
The collected logs are converted to JSON using the to_json() procedure of the xm_json module.
<Extension json>
    Module      xm_json
</Extension>

<Input etw>
    Module      im_etw
    Provider    Microsoft-Windows-DNSServer
    Exec        to_json();
</Input>EventID: 515, identifying creation of a new record in the zone example.com{
"SourceName": "Microsoft-Windows-DNSServer",
"ProviderGuid": "{EB79061A-A566-4698-9119-3ED2807060E7}",
"EventID": 515,
"Version": 0,
"ChannelID": 17,
"OpcodeValue": 0,
"TaskValue": 5,
"Keywords": "4611686018428436480",
"EventTime": "2020-03-10T09:42:39.788511-07:00",
"ExecutionProcessID": 4752,
"ExecutionThreadID": 1732,
"EventType": "INFO",
"SeverityValue": 2,
"Severity": "INFO",
"Domain": "WIN-R4QHULN6KLH",
"AccountName": "Administrator",
"UserID": "S-1-5-21-915329490-2962477901-227355065-500",
"AccountType": "User",
"Flags": "EXTENDED_INFO|IS_64_BIT_HEADER|PROCESSOR_INDEX (577)",
"Type": "1",
"NAME": "www.example.com",
"TTL": "3600",
"BufferSize": "4",
"RDATA": "0x0A00020F",
"Zone": "example.com",
"ZoneScope": "Default",
"VirtualizationID": ".",
"EventReceivedTime": "2020-03-10T09:42:40.801598-07:00",
"SourceModuleName": "etw",
"SourceModuleType": "im_etw"
}File-based DNS debug logging
Windows DNS debug logging is the only means of monitoring DNS events on Windows Server versions before Windows Server 2012 R2. However, DNS Servers capable of ETW might be configured for file-based logging in cases where all events must be captured without exception.
Enabling DNS debug logging
Follow these steps to enable DNS debug logging:
-
Open the DNS Management console (
dnsmgmt.msc). -
Right-click on the DNS Server and choose Properties from the context menu.
-
Under the Debug Logging tab, enable Log packets for debugging.
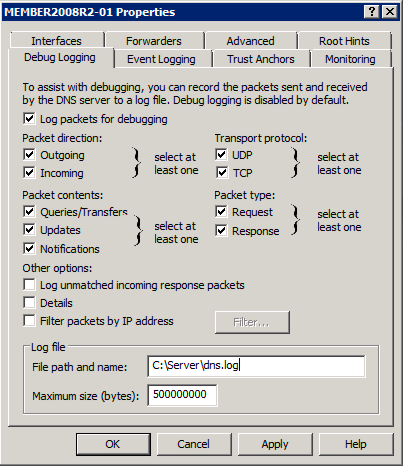 Figure 1. DNS Server Properties window
 -
Select the checkboxes corresponding to the data that should be logged.
The Details option will produce multi-line logs. To parse this detailed format, refer to the Parsing detailed DNS debug logs with regular expressions section below. -
Set the File path and name to the desired log file location.
The Windows DNS service may not recreate the debug log file after a rollover. If you encounter this issue, use the C: drivefor the debug log path. For a detailed explanation, see The disappearing Windows DNS debug log on the NXLog blog.
4/21/2017 7:52:03 AM 06B0 PACKET 00000000028657F0 UDP Snd 10.2.0.1 6590 R Q [8081 DR NOERROR] A (7)example(3)com(0)Parsing non-detailed DNS debug logs with xm_msdns
The xm_msdns module, available in NXLog Enterprise Edition, can parse Windows DNS Server logs.
| This module does not support parsing DNS logs in the detailed debug logging format. See Parsing detailed DNS debug logs with regular expressions. |
| This module has been tested on Windows Server versions 2008 R2, 2012 R2, and 2016. |
This configuration uses the im_file and xm_msdns modules to read and parse the DNS debug log file. The collected logs are converted to JSON using the to_json() procedure of the xm_json module.
<Extension json>
    Module        xm_json
</Extension>

<Extension dns_parser>
    Module        xm_msdns
    EventLine     TRUE
    PacketLine    TRUE
    NoteLine      TRUE
</Extension>

<Input dns_logs>
    Module        im_file
    File          'C:\Server\dns.log'
    InputType     dns_parser
    Exec          to_json();
</Input>{
"EventTime": "2022-09-20 07:52:03",
"ThreadId": "06B0",
"Context": "PACKET",
"InternalPacketIdentifier": "00000000028657F0",
"Protocol": "UDP",
"SendReceiveIndicator": "Snd",
"RemoteIP": "10.2.0.1",
"Xid": "6590",
"QueryResponseIndicator": "Response",
"Opcode": "Standard Query",
"FlagsHex": "8081",
"RecursionDesired": true,
"RecursionAvailable": true,
"ResponseCode": "NOERROR",
"QuestionType": "A",
"QuestionName": "example.com",
"EventReceivedTime": "2022-09-20 7:52:03",
"SourceModuleName": "dns_logs",
"SourceModuleType": "im_file"
}Parsing non-detailed DNS debug logs with regular expressions
While the xm_msdns module is the preferred method and is about three times faster, you can also use regular expressions to parse DNS debug logs.
| This example does not parse DNS logs in the detailed debug logging format. See the Parsing detailed DNS debug logs with regular expressions section above. |
| This example has been tested on Windows Server versions 2008 R2, 2012 R2, and 2016. |
This configuration collects DNS debug logs using the im_file input module and parses them with regular expressions. The collected logs are converted to JSON using the to_json() procedure of the xm_json module.
define EVENT_REGEX                     /(?x)(?<Date>\d+(?:\/\d+){2})\s \
                                       (?<Time>\d+(?:\:\d+){2}\s\w+)\s \
                                       (?<ThreadId>\w+)\s+ \
                                       (?<Context>\w+)\s+ \
                                       (?<InternalPacketIdentifier>[[:xdigit:]]+)\s+ \
                                       (?<Protocol>\w+)\s+ \
                                       (?<SendReceiveIndicator>\w+)\s \
                                       (?<RemoteIP>[[:xdigit:].:]+)\s+ \
                                       (?<Xid>[[:xdigit:]]+)\s \
                                       (?<QueryType>\s|R)\s \
                                       (?<Opcode>[A-Z]|\?)\s \
                                       (?<QFlags>\[(.*?)\])\s+ \
                                       (?<QuestionType>\w)\s+ \
                                       (?<QuestionName>.*)/

define EMPTY_EVENT_REGEX               /(^$|^\s+$)/

define DOMAIN_REGEX                    /\(\d+\)([\w-]+)\(\d+\)([\w-]+)/

define SUBDOMAIN_REGEX                 /\(\d+\)([\w-]+)\(\d+\)([\w-]+)\(\d+\)(\w+)/

define NOT_STARTING_WITH_DATE_REGEX    /^(?!\d+\/\d+\/\d+).+/

define QFLAGS_REGEX                    /(?x)(?<FlagsHex>\d+)\s+ \
                                       (?<FlagsCharCodes>\s+|([A-Z]{2}|[A-Z]))\s+ \
                                       (?<ResponseCode>\w+)/

<Extension json>
    Module    xm_json
</Extension>

<Input dns_logs>
    Module    im_file
    File      'C:\Server\dns.log'
    <Exec>
        # Drop entries that have empty lines
        if $raw_event =~ %EMPTY_EVENT_REGEX% {
            drop();
        }

        # Drop entries not starting with a date
        if $raw_event =~ %NOT_STARTING_WITH_DATE_REGEX% {
            drop();
        }

        # Split entries into fields & define regular entries
        if $raw_event =~ %EVENT_REGEX% {
            $Regular = TRUE;
            $EventTime  = parsedate($Date + " " + $Time);
            $Raw = $raw_event;
            delete($date);
            delete($time);
            if $FlagsCharCodes =~ /^\s+$/ {
                delete($FlagsCharCodes );
            }

            # Convert domains from (8)mydomain(1)com to mydomain.com
            if $QuestionName =~ %DOMAIN_REGEX% {
                $QuestionName = $1 + "." + $2;
            }

            # Convert domains from (8)sub(8)mydomain(1)com to sub.mydomain.com
            if $QuestionName =~ %SUBDOMAIN_REGEX% {
                $QuestionName = $1 + "." + $2 + "." +$3;
            }

            # Set query flags
            if $QFlags =~ %QFLAGS_REGEX% {
                delete($QFlags);
            }

            # Set the query type
            if $QueryType =~ %EMPTY_EVENT_REGEX% {
                $QueryType = "query";
            }
            else {
                $QueryType = "response";
            }
        }
        else
        {
            $Regular = FALSE;
            $Raw = $raw_event;
        }

        to_json();
    </Exec>
</Input>{
"EventReceivedTime": "2022-09-20 07:52:16",
"SourceModuleName": "dns_logs",
"SourceModuleType": "im_file",
"Context": "PACKET",
"InternalPacketIdentifier": "00000000028657F0",
"Opcode": "Q",
"Protocol": "UDP",
"QueryType": "response",
"QuestionName": "example.com",
"QuestionType": "A",
"RemoteIP": "10.2.0.1",
"SendReceiveIndicator": "Snd",
"ThreadId": "06B0",
"Xid": "6590",
"Regular": true,
"EventTime": "2022-09-20 07:52:03",
"Raw": "9/20/2022 7:52:03 AM 06B0 PACKET 00000000028657F0 UDP Snd 10.2.0.1 6590 R Q [8081 DR NOERROR] A (9)example(3)com(0)",
"FlagsCharCodes": "DR",
"FlagsHex": "8081",
"ResponseCode": "NOERROR"
}Parsing detailed DNS debug logs with regular expressions
Detailed DNS debug logging uses a multi-line format that can be parsed with xm_multiline and regular expressions.
In this example, the xm_multiline module joins lines that belong to the same event by using a regular expression to match the header line. Then another regular expression is used to parse the content into fields. The collected logs are converted to JSON using the to_json() procedure of the xm_json module.
9/20/2022 8:33:36 PM 09B8 PACKET  0000022041EED460 UDP Rcv 192.168.56.1    edaa   Q [2001   D   NOERROR] A      (6)example(3)com(0)
UDP question info at 0000022041EED460
  Socket = 680
  Remote addr 192.168.56.1, port 48210
  Time Query=6941, Queued=0, Expire=0
  Buf length = 0x0fa0 (4000)
  Msg length = 0x0027 (39)
  Message:
    XID       0xedaa
    Flags     0x0120
      QR        0 (QUESTION)
      OPCODE    0 (QUERY)
      AA        0
      TC        0
      RD        1
      RA        0
      Z         0
      CD        0
      AD        1
RCODE 0 (NOERROR)define EVENT_REGEX /(?x)(?<Date>\d+(?:\/\d+){2})\s \
(?<Time>\d+(?:\:\d+){2}\s\w+)\s \
(?<ThreadId>\w+)\s+ \
(?<Context>\w+)\s+ \
(?<InternalPacketIdentifier>[[:xdigit:]]+)\s+ \
(?<Protocol>\w+)\s+ \
(?<SendReceiveIndicator>\w+)\s \
(?<RemoteIP>[[:xdigit:].:]+)\s+ \
(?<Xid>[[:xdigit:]]+)\s \
(?<QueryType>\s|R)\s \
(?<Opcode>[A-Z]|\?)\s \
(?<QFlags>\[(.*?)\])\s+ \
(?<QuestionType>\w+)\s+ \
(?<QuestionName>.*)\s+ \
(?<LogInfo>.+)\s+.+=\s \
(?<Socket>\d+)\s+ Remote\s+ addr\s \
(?<RemoteAddr>.+),\sport\s \
(?<PortNum>\d+)\s+Time\sQuery= \
(?<TimeQuery>\d+),\sQueued= \
(?<Queued>\d+),\sExpire= \
(?<Expire>\d+)\s+.+\( \
(?<BufLen>\d+)\)\s+.+\( \
(?<MsgLen>\d+)\)\s+Message:\s+ \
(?<Message>(?s).*)/
define HEADER_REGEX /(?x)(?<Date>\d+(?:\/\d+){2})\s \
(?<Time>\d+(?:\:\d+){2}\s\w+)\s \
(?<ThreadId>\w+)\s+ \
(?<Context>\w+)\s+ \
(?<InternalPacketIdentifier>[[:xdigit:]]+)\s+ \
(?<Protocol>\w+)\s+ \
(?<SendReceiveIndicator>\w+)\s \
(?<RemoteIP>[[:xdigit:].:]+)\s+ \
(?<Xid>[[:xdigit:]]+)\s \
(?<QueryType>\s|R)\s \
(?<Opcode>[A-Z]|\?)\s \
(?<QFlags>\[(.*?)\])\s+ \
(?<QuestionType>\w+)\s+ \
(?<QuestionName>.*)/
<Extension json>
Module xm_json
</Extension>
<Extension multiline>
Module xm_multiline
HeaderLine %HEADER_REGEX%
</Extension>
<Input dns_logs>
Module im_file
File 'C:\Server\dns.log'
InputType multiline
<Exec>
if $raw_event =~ %EVENT_REGEX%
{
$EventTime = parsedate($Date + " " + $Time);
delete($Date);
delete($Time);
to_json();
}
</Exec>
</Input>{
"EventReceivedTime": "2022-09-20T20:33:38.660127+01:00",
"SourceModuleName": "dns_logs",
"SourceModuleType": "im_file",
"BufLen": "512",
"Context": "PACKET",
"Expire": "0",
"InternalPacketIdentifier": "000000D58F45A560",
"LogInfo": "UDP response info at 000000D58F45A560",
"Message": "XID 0x000d\r\n Flags 0x8180\r\n QR 1 (RESPONSE)\r\n OPCODE 0 (QUERY)\r\n AA 0\r\n TC 0\r\n RD 1\r\n RA 1\r\n Z 0\r\n CD 0\r\n AD 0\r\n RCODE 0 (NOERROR)\r\n QCOUNT 1\r\n ACOUNT 1\r\n NSCOUNT 0\r\n ARCOUNT 0\r\n QUESTION SECTION:\r\n Offset = 0x000c, RR count = 0\r\n Name \"(6)example(3)com(0)\"\r\n QTYPE AAAA (28)\r\n QCLASS 1\r\n ANSWER SECTION:\r\n Offset = 0x001c, RR count = 0\r\n Name \"[C00C](6)example(3)com(0)\"\r\n TYPE AAAA (28)\r\n CLASS 1\r\n TTL 26\r\n DLEN 16\r\n DATA 2a00:1450:400d:805::200e\r\n AUTHORITY SECTION:\r\n empty\r\n ADDITIONAL SECTION:\r\n empty\r\n",
"MsgLen": "56",
"Opcode": "Q",
"PortNum": "60010",
"Protocol": "UDP",
"QFlags": "[8081 DR NOERROR]",
"QueryType": "R",
"QuestionName": "(6)example(3)com(0)",
"QuestionType": "AAAA",
"Queued": "0",
"RemoteAddr": "::1",
"RemoteIP": "::1",
"SendReceiveIndicator": "Snd",
"Socket": "512",
"ThreadId": "044C",
"TimeQuery": "12131",
"Xid": "000d",
"EventTime": "2022-09-20T20:33:36.000000+01:00"
}Collecting DNS query logs via Sysmon
Another potential source of DNS event logs is Sysmon. It is a system service and device driver which monitors system activity and logs events to Windows Event Log. See Setting up Sysmon for further details.
The DNS events logged by Sysmon are not the same as other DNS monitoring events like DNS Server Audit and Analytical logging or DNS Server debug logging.
For example, Sysmon DNS query logging only logs client DNS queries.
Yet, the information it supplies compliments the DNS Server Analytical logs by adding the name and path of the application querying the DNS Server.
It can monitor DNS queries initiated by any network-enabled Windows client software, for instance, web browsers, FileZilla, WinSCP, ping, tracert, etc.
However, Sysmon does not log direct DNS lookups done with nslookup.
Configure DNS query logging
Sysmon does not log DNS client queries by default.
To enable DNS query logging, create a Sysmon configuration file in the same directory as Sysmon.exe:
<Sysmon schemaversion="4.22">
  <EventFiltering>
    <DnsQuery onmatch="exclude"/>
  </EventFiltering>
</Sysmon>
Then, execute the following command to apply the new configuration:
C:\Windows> Sysmon.exe -c config-dnsquery.xmlTo confirm that the new configuration has been applied, execute the following command:
C:\Windows> Sysmon.exe -cThe last few lines of output returned from Sysmon should produce the following confirmation that DNS Query logging is active:
Rule configuration (version 4.22):
 - DnsQuery              onmatch: exclude   combine rules using 'And'
You can find a good resource for configuring Sysmon to log DNS events in the sysmon-config GitHub repository.
Despite sysmonconfig-export.xml being an XML file, the DNS section starting at line 885 <!--SYSMON EVENT ID 22 : DNS QUERY [DnsQuery]--> contains a good description of the configuration.
It includes a complete RuleGroup example for filtering out known domains to reduce noise from ads and other sources that generate many events for harmless DNS lookups.
|
Once Sysmon is active and running as a service, it will log various events in addition to DNS queries.
You can find the events in Windows Event Viewer under Applications and Services Log > Microsoft > Windows > Sysmon > Operational.
Each event has an associated EventID.
For example, Sysmon Event ID 22, DNSEvent (DNS query), is generated when a process executes a DNS query, whether the result is successful or fails, cached or not.
The telemetry for this event was added for Windows 8.1 and is unavailable on Windows 7 and earlier.
See the Sysmon section for more information.
| Sysmon creates an ETW trace session to collect DNS events and writes the data to the Windows Event Log. You can collect these events with the im_msvistalog module. However, we recommend using the im_etw module to collect logs directly from the DNS providers to minimize computational overhead. |
This configuration uses the im_msvistalog module to collect Sysmon DNS query events from the Microsoft-Windows-Sysmon/Operational channel.
The collected logs are converted to JSON using the to_json() procedure of the xm_json module.
<Extension json>
    Module    xm_json
</Extension>

<Input sysmon>
    Module    im_msvistalog
    <QueryXML>
        <QueryList>
            <Query Id="0">
                <Select Path="Microsoft-Windows-Sysmon/Operational">
                    *[System[(EventID='22')]]
                </Select>
            </Query>
        </QueryList>
    </QueryXML>
    Exec      to_json();
</Input>{
"EventTime": "2022-09-20T15:47:43.685222+00:00",
"Hostname": "HOST1",
"Keywords": "9223372036854775808",
"EventType": "INFO",
"SeverityValue": 2,
"Severity": "INFO",
"EventID": 22,
"SourceName": "Microsoft-Windows-Sysmon",
"ProviderGuid": "{5770385F-C22A-43E0-BF4C-06F5698FFBD9}",
"Version": 5,
"TaskValue": 22,
"OpcodeValue": 0,
"RecordNumber": 9152,
"ExecutionProcessID": 3880,
"ExecutionThreadID": 868,
"Channel": "Microsoft-Windows-Sysmon/Operational",
"Domain": "NT AUTHORITY",
"AccountName": "SYSTEM",
"UserID": "S-1-5-18",
"AccountType": "User",
"Message": "Dns query:\r\nRuleName: \r\nUtcTime: 2022-09-20 15:47:43.274\r\nProcessGuid: {b3c285a4-5f1e-5db8-0000-0010c24d1d00}\r\nProcessId: 5696\r\nQueryName: example.com\r\nQueryStatus: 0\r\nQueryResults: ::ffff:93.184.216.34;\r\nImage: C:\\Windows\\System32\\PING.EXE",
"Category": "Dns query (rule: DnsQuery)",
"Opcode": "Info",
"UtcTime": "2022-09-20 15:47:43.274",
"ProcessGuid": "{b3c285a4-5f1e-5db8-0000-0010c24d1d00}",
"ProcessId": "5696",
"QueryName": "example.com",
"QueryStatus": "0",
"QueryResults": "::ffff:93.184.216.34;",
"Image": "C:\\Windows\\System32\\PING.EXE",
"EventReceivedTime": "2022-09-20T15:47:44.949924+00:00",
"SourceModuleName": "sysmon",
"SourceModuleType": "im_msvistalog"
}Summary of DNS query fields
The fields of particular interest are the QueryName and Image fields, which provide information about the client machine’s network activity.
From these fields, you can identify which site, internal or external, was queried and which Windows application was preparing to access that remote site.
The Message field usually contains a long string of information which NXLog will parse into the following fields:
-
UtcTime(used to createEventTime) -
ProcessGuid -
ProcessId -
QueryName(the FQDN being looked up) -
QueryStatus -
QueryResults -
Image(the full path and filename of the client application’s executable that performed the DNS query)
Logging DNS event sources using Windows Event Log
The im_msvistalog module is the most versatile input module for Windows since it can capture almost any event type. For example, it can be used to collect DNS Server Audit events, DNS client events from Sysmon, and native DNS Client events with a single configuration.
Collecting native DNS client logs
Another source for collecting DNS client logs is the Microsoft-Windows-DNS-Client/Operational channel.
This configuration uses the im_msvistalog module to collect DNS client events from the Microsoft-Windows-DNS-Client/Operational channel.
The QueryXML block filters for select event IDs.
The Exec block drops events for queries for wpad and types other than 1.
The collected logs are then converted to JSON using the to_json() procedure of the xm_json module.
<Extension json>
    Module    xm_json
</Extension>

<Input dns_client>
    Module    im_msvistalog
    <QueryXML>
        <QueryList>
            <Query Id="0">
                <Select Path="Microsoft-Windows-DNS-Client/Operational">
                    *[System[(EventID=3006 or EventID=3008 or
                              EventID=3010 or EventID=3018)]]
                </Select>
            </Query>
        </QueryList>
    </QueryXML>
    <Exec>
        if ($QueryName == 'wpad') OR ($QueryType != '1') {
            drop();
        }
        to_json();
    </Exec>
</Input>{
"EventTime": "2022-09-20T14:40:08.809107-07:00",
"Hostname": "WIN-R4QHULN6KLH",
"Keywords": "9223372036854775808",
"EventType": "INFO",
"SeverityValue": 2,
"Severity": "INFO",
"EventID": 3006,
"SourceName": "Microsoft-Windows-DNS-Client",
"ProviderGuid": "{1C95126E-7EEA-49A9-A3FE-A378B03DDB4D}",
"Version": 0,
"TaskValue": 0,
"OpcodeValue": 0,
"RecordNumber": 42095,
"ExecutionProcessID": 2224,
"ExecutionThreadID": 4672,
"Channel": "Microsoft-Windows-DNS-Client/Operational",
"Domain": "WIN-R4QHULN6KLH",
"AccountName": "Administrator",
"UserID": "S-1-5-21-915329490-2962477901-227355065-500",
"AccountType": "User",
"Message": "DNS query is called for the name ntp.msn.com, type 1, query options 140738562228224, Server List , isNetwork query 0, network index 0, interface index 0, is asynchronous query 0",
"Opcode": "Info",
"QueryName": "ntp.msn.com",
"QueryType": "1",
"QueryOptions": "140738562228224",
"IsNetworkQuery": "0",
"NetworkQueryIndex": "0",
"InterfaceIndex": "0",
"IsAsyncQuery": "0",
"EventReceivedTime": "2022-09-20T14:40:10.674875-07:00",
"SourceModuleName": "dns_client",
"SourceModuleType": "im_msvistalog"
}Collecting DNS Server audit logs
Although the im_msvistalog module can collect DNS Server audit events, using im_etw is a better choice when performance is a concern and remains the recommended method.
This configuration uses the im_msvistalog module to collect DNS audit events from the Microsoft-Windows-DNSServer/Audit channel.
It collects all audit events since most are important, and audit logs tend to be much lower in volume than analytical or debug logs.
The events are converted to JSON using the to_json() procedure of the xm_json module.
<Extension json>
    Module    xm_json
</Extension>

<Input dns_audit>
    Module    im_msvistalog
    <QueryXML>
        <QueryList>
            <Query Id="0">
                <Select Path="Microsoft-Windows-DNSServer/Audit">*</Select>
            </Query>
        </QueryList>
    </QueryXML>
    Exec      to_json();
</Input>{
"EventTime": "2022-09-20T14:56:07.622472-07:00",
"Hostname": "WIN-R4QHULN6KLH",
"Keywords": "4611686018428436480",
"EventType": "INFO",
"SeverityValue": 2,
"Severity": "INFO",
"EventID": 516,
"SourceName": "Microsoft-Windows-DNSServer",
"ProviderGuid": "{EB79061A-A566-4698-9119-3ED2807060E7}",
"Version": 0,
"TaskValue": 5,
"OpcodeValue": 0,
"RecordNumber": 98,
"ExecutionProcessID": 2000,
"ExecutionThreadID": 4652,
"Channel": "Microsoft-Windows-DNSServer/Audit",
"Domain": "WIN-R4QHULN6KLH",
"AccountName": "Administrator",
"UserID": "S-1-5-21-915329490-2962477901-227355065-500",
"AccountType": "User",
"Message": "A resource record of type 1, name ns2.example.com and RDATA 0x0A000210 was deleted from scope Default of zone example.com.",
"Category": "ZONE_OP",
"Opcode": "Info",
"Type": "1",
"NAME": "ns2.example.com",
"TTL": "0",
"BufferSize": "4",
"RDATA": "0A000210",
"Zone": "example.com",
"ZoneScope": "Default",
"VirtualizationID": ".",
"EventReceivedTime": "2022-09-20T14:56:09.343045-07:00",
"SourceModuleName": "dns_audit",
"SourceModuleType": "im_msvistalog"
}Collecting DNS Server analytical logs
One limitation of the im_msvistalog module is that it cannot read event traces of analytical sources.
For this reason, the im_etw module remains the preferred choice for collecting events from the DNS Server Analytical log.
It is possible to leverage the File directive in im_msvistalog to read DNS Server Analytical logs from .etl files.
The active DNS Server Analytical log file is located at:
%SystemRoot%\System32\Winevt\Logs\Microsoft-Windows-DNSServer%4Analytical.etlA limitation of reading .etl files with im_msvistalog is that the module cannot seek in such files, resulting in the file being read from the beginning every time NXLog is started.
Therefore, you should only use this method to process DNS Server analytical logs in archived .etl files and not monitor active .etl files.
This example uses the im_msvistalog module to collect DNS analytical events.
Analytical log sources, like debug log sources, tend to generate a high volume of events that are not always useful. In this configuration, an analysis of the log file determined that frequent lookups on ten specific hosts were responsible for a sizable portion of the log file. Since none of these hosts are of interest for security monitoring, the configuration filters them out to reduce noise.
The collected logs are converted to JSON using the to_json() procedure of the xm_json module.
<Extension json>
    Module    xm_json
</Extension>

<Input dns_analytical>
    Module    im_msvistalog
    File      C:\temp\DNSServer%4Analytical-Archive.etl
    <Exec>
        if ($QNAME == 'americas1.notify.windows.com.akadns.net.') OR \
           ($QNAME == 'cy2.vortex.data.microsoft.com.akadns.net.') OR \
           ($QNAME == 'dm3p.wns.notify.windows.com.akadns.net.') OR \
           ($QNAME == 'geo.vortex.data.microsoft.com.akadns.net.') OR \
           ($QNAME == 'v10-win.vortex.data.microsoft.com.akadns.net.') OR \
           ($QNAME == 'v10-win.vortex.data.microsoft.com.akadns.NET.') OR \
           ($QNAME == 'v10.vortex-win.data.microsoft.com.') OR \
           ($QNAME == 'wns.notify.windows.com.akadns.net.') OR \
           ($QNAME == 'wns.notify.windows.com.akadns.NET.') OR \
           ($QNAME == 'client.wns.windows.com.') OR \
           ($QTYPE == '15') {
            drop();
        }
        to_json();
    </Exec>
</Input>{
"EventTime": "2022-09-20T19:21:47.052133-07:00",
"Hostname": "WIN-R4QHULN6KLH",
"Keywords": "9223372071214514176",
"EventType": "INFO",
"SeverityValue": 2,
"Severity": "INFO",
"EventID": 279,
"SourceName": "Microsoft-Windows-DNSServer",
"ProviderGuid": "{EB79061A-A566-4698-9119-3ED2807060E7}",
"Version": 0,
"TaskValue": 1,
"OpcodeValue": 0,
"RecordNumber": 60,
"ExecutionProcessID": 2000,
"ExecutionThreadID": 4188,
"Domain": "NT AUTHORITY",
"AccountName": "SYSTEM",
"UserID": "S-1-5-18",
"AccountType": "User",
"Message": "INTERNAL_LOOKUP_CNAME: TCP=0; InterfaceIP=10.0.2.15; Source=10.0.2.15; RD=1; QNAME=ns1.example.com.; QTYPE=1; Port=54171; Flags=34176; XID=2; PacketData=0x00028580000100010000000003777777076578616D706C6503636F6D0000010001",
"Category": "LOOK_UP",
"Opcode": "Info",
"TCP": "0",
"InterfaceIP": "10.0.2.15",
"Source": "10.0.2.15",
"RD": "1",
"QNAME": "ns1.example.com.",
"QTYPE": "1",
"Port": "54171",
"Flags": "34176",
"XID": "2",
"BufferSize": "33",
"PacketData": "00028580000100010000000003777777076578616D706C6503636F6D0000010001",
"EventReceivedTime": "2022-09-20T19:28:51.560303-07:00",
"SourceModuleName": "dns_analytical",
"SourceModuleType": "im_msvistalog"
}